


You are viewing documentation for KubeSphere version:v3.0.0
KubeSphere v3.0.0 documentation is no longer actively maintained. The version you are currently viewing is a static snapshot. For up-to-date documentation, see the latest version.


Monitor MySQL
From the Introduction section, you know it is not feasible to instrument MySQL with Prometheus metrics directly. To expose MySQL metrics in Prometheus format, you need to deploy MySQL exporter instead.
This tutorial walks you through an example of how to monitor MySQL metrics and visualize them.
Prerequisites
- Please make sure you enable the OpenPitrix system. MySQL and MySQL exporter will be deployed from the App Store.
- You need to create a workspace, a project, and a user account for this tutorial. For more information, see Create Workspaces, Projects, Accounts and Roles. The account needs to be a platform regular user and to be invited as the project operator with the
operatorrole. In this tutorial, you log in asproject-operatorand work in the projectdemoin the workspacedemo-workspace.
Hands-on Lab
Step 1: Deploy MySQL
To begin with, you deploy MySQL from the App Store and set the root password to testing.
-
Go to the project
demoand click App Store in the top left corner.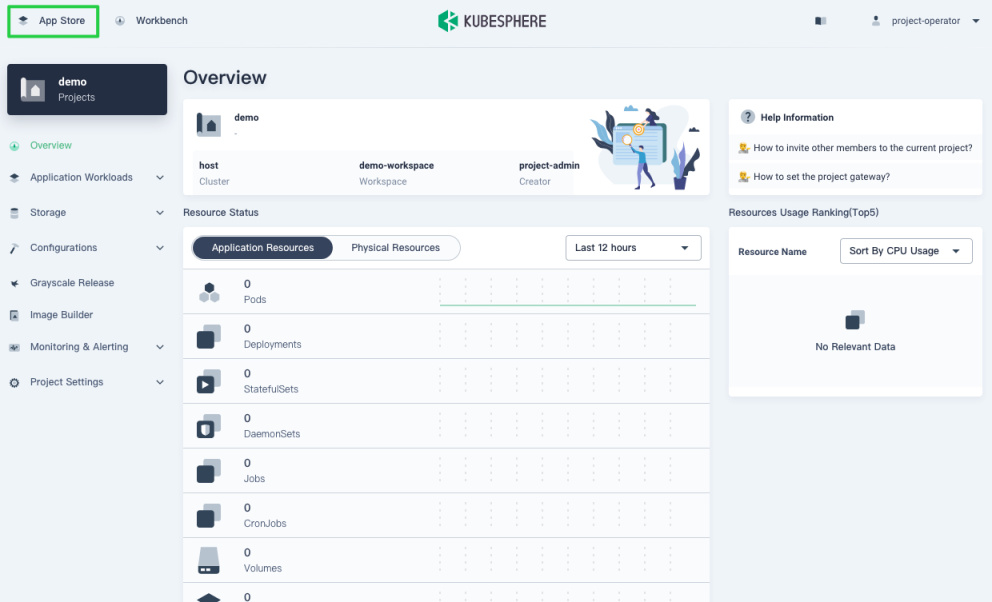
-
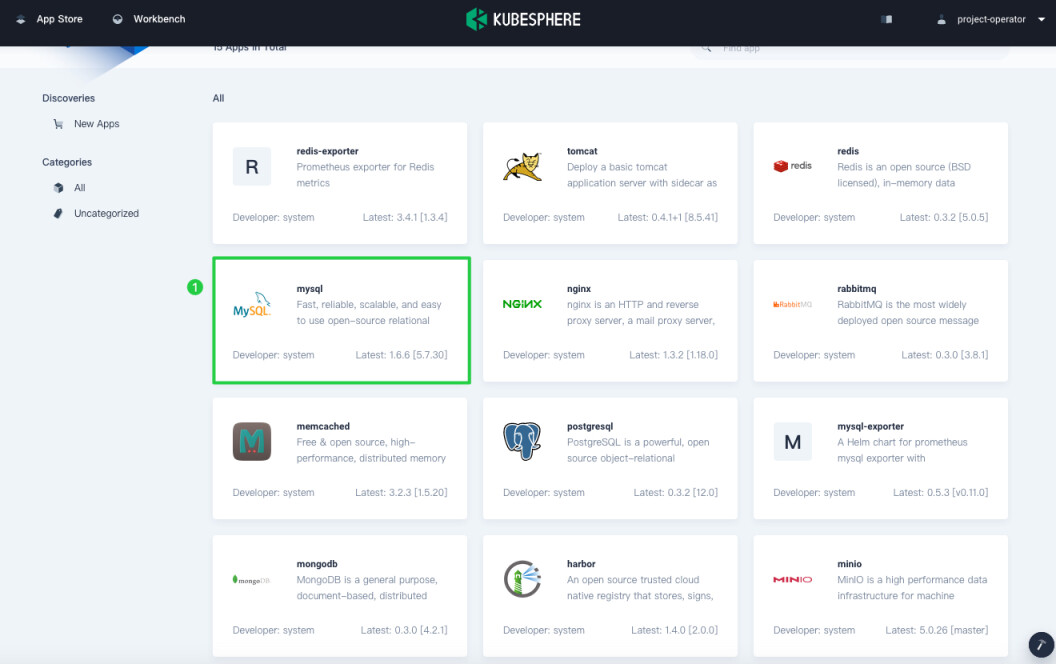
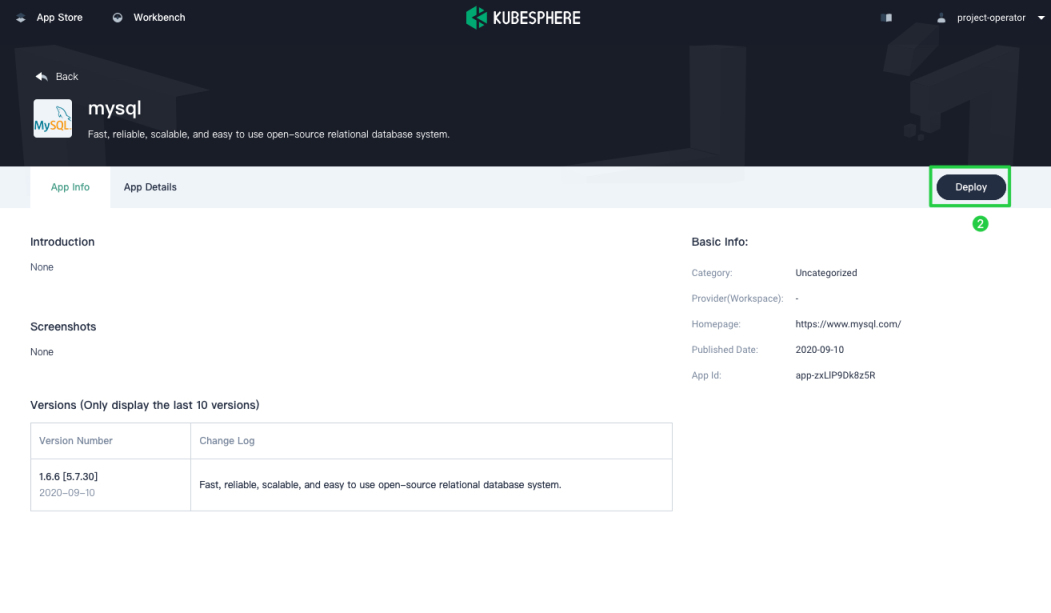
Find MySQL and click Deploy.
-
Make sure MySQL is deployed in
demoand click Next.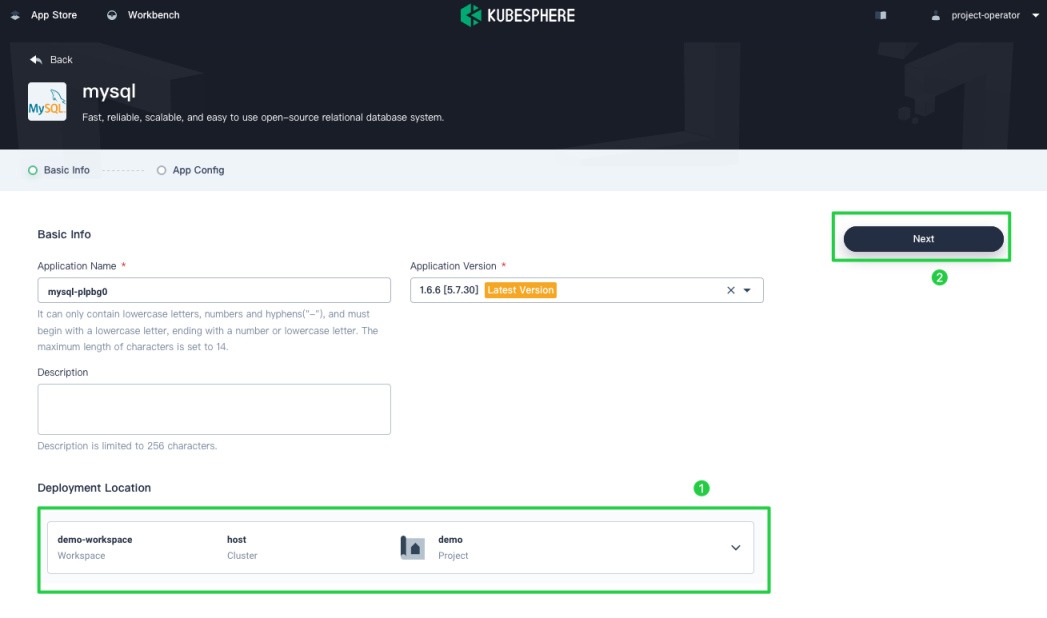
-
Uncomment the
mysqlRootPasswordfield and click Deploy.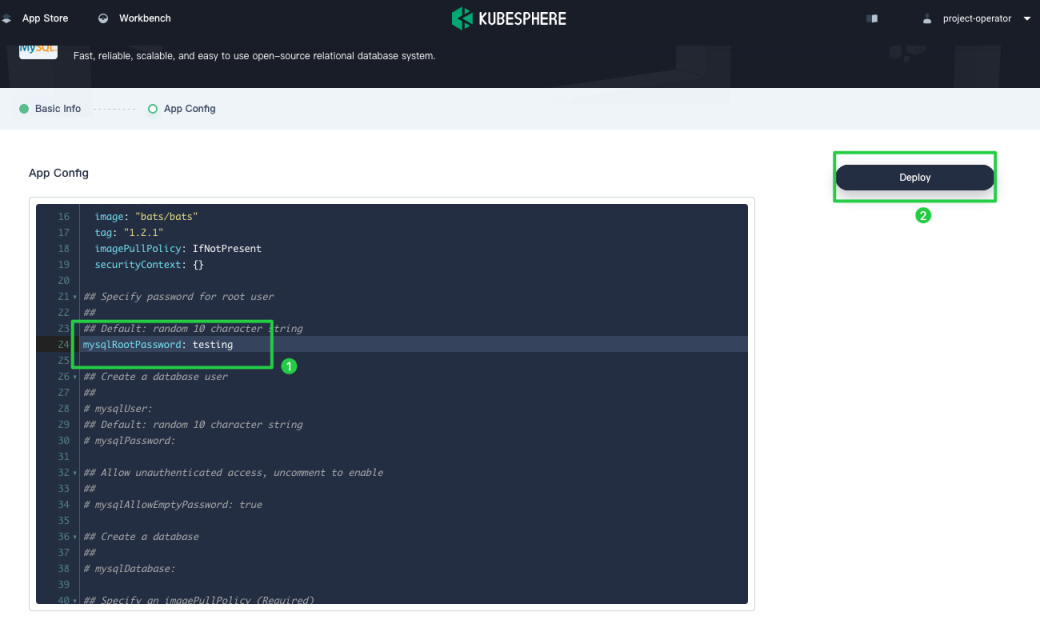
-
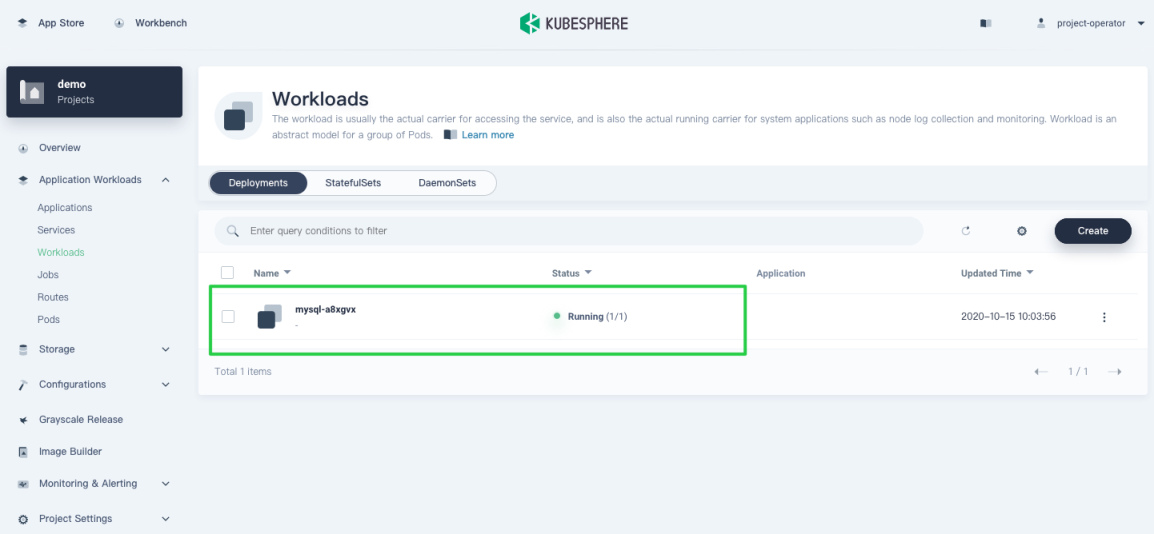
Wait until MySQL is up and running.
Step 2: Deploy MySQL exporter
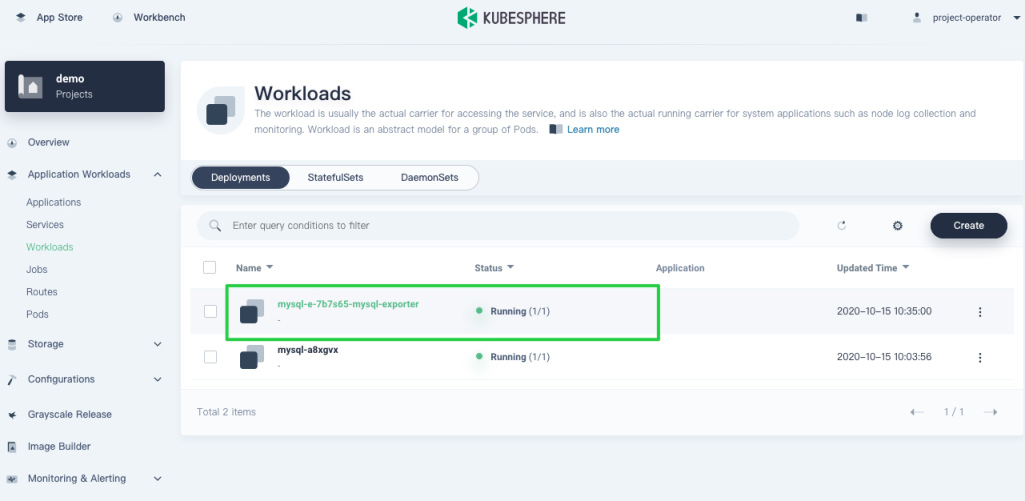
You need to deploy MySQL exporter in demo on the same cluster. MySQL exporter is responsible for querying MySQL status and reports the data in Prometheus format.
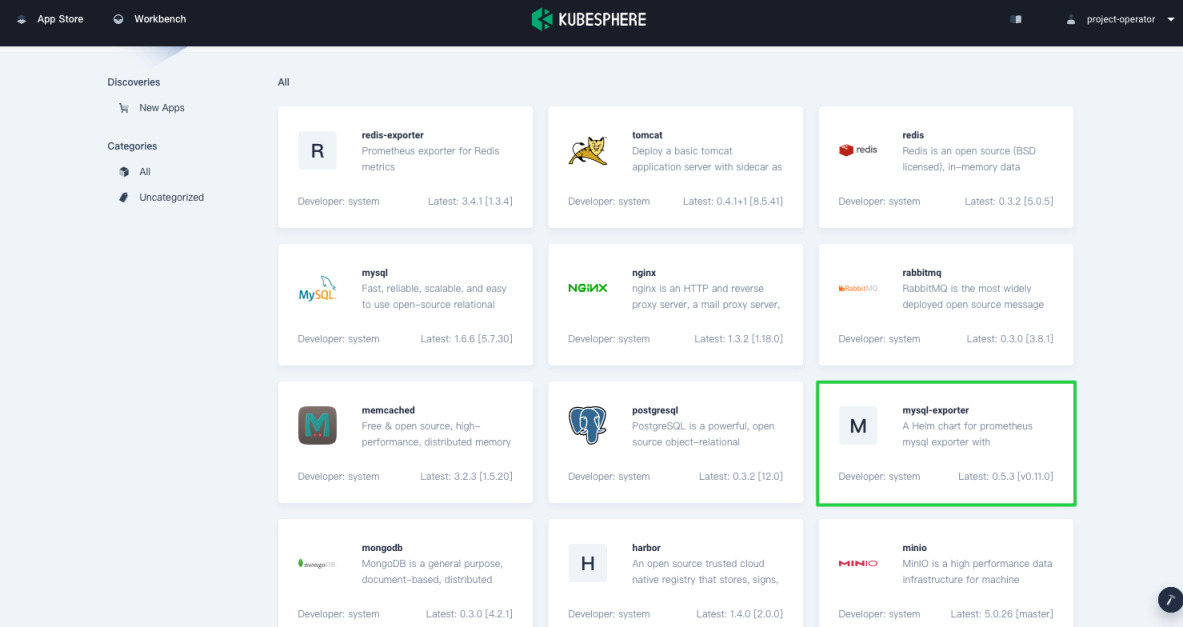
-
Go to App Store and find MySQL exporter.
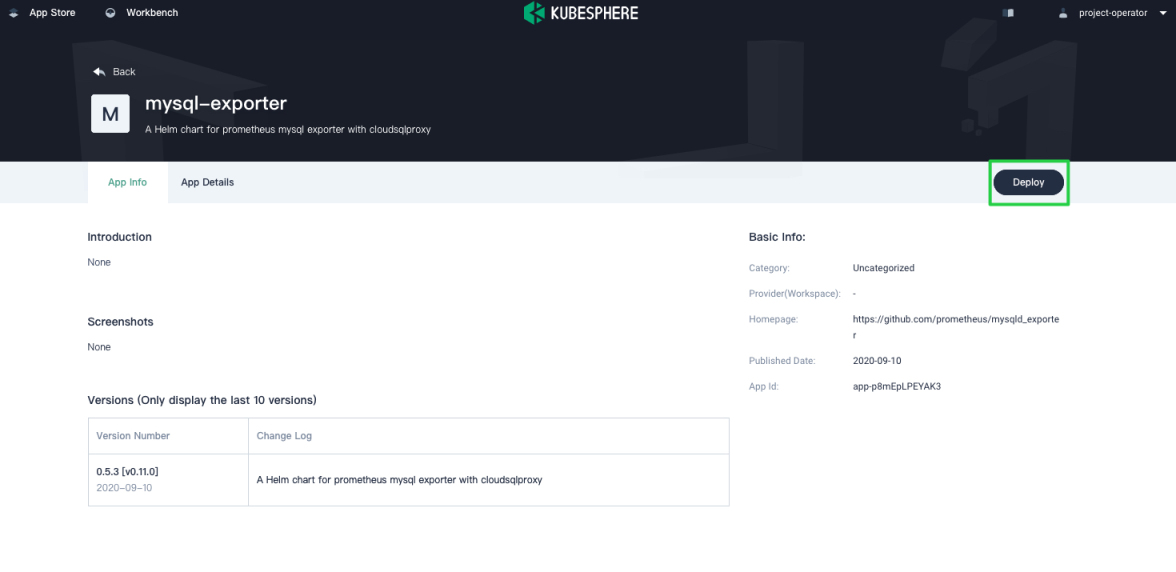
-
Deploy MySQL exporter in
demoagain.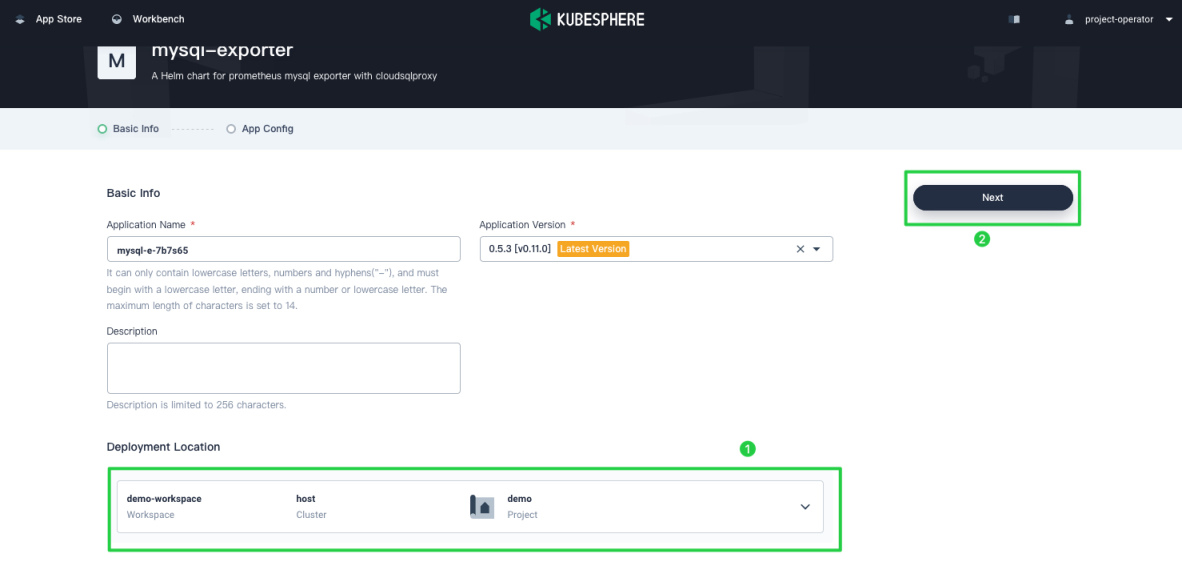
-
Make sure
serviceMonitor.enabledis set totrue. The built-in MySQL exporter sets it totrueby default, so you don’t have to manually modifyserviceMonitor.enabled.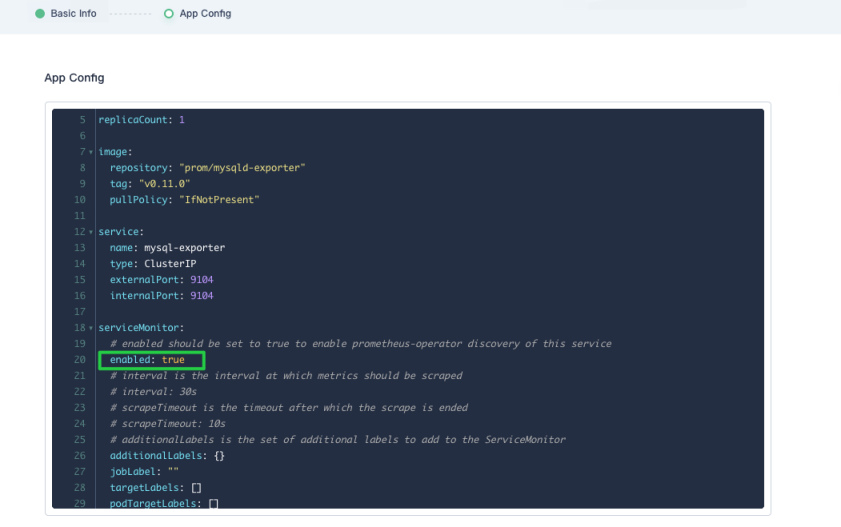
Warning
Don’t forget to enable the ServiceMonitor CRD if you are using external exporter Helm charts. Those charts usually disable ServiceMonitor by default and require manual modification. -
Modify MySQL connection parameters. MySQL exporter needs to connect to the target MySQL. In this tutorial, MySQL is installed with the service name
mysql-a8xgvx. Setmysql.hosttomysql-a8xgvx,mysql.passtotesting, andusertorootas below. Note that your MySQL service may be created with a different name.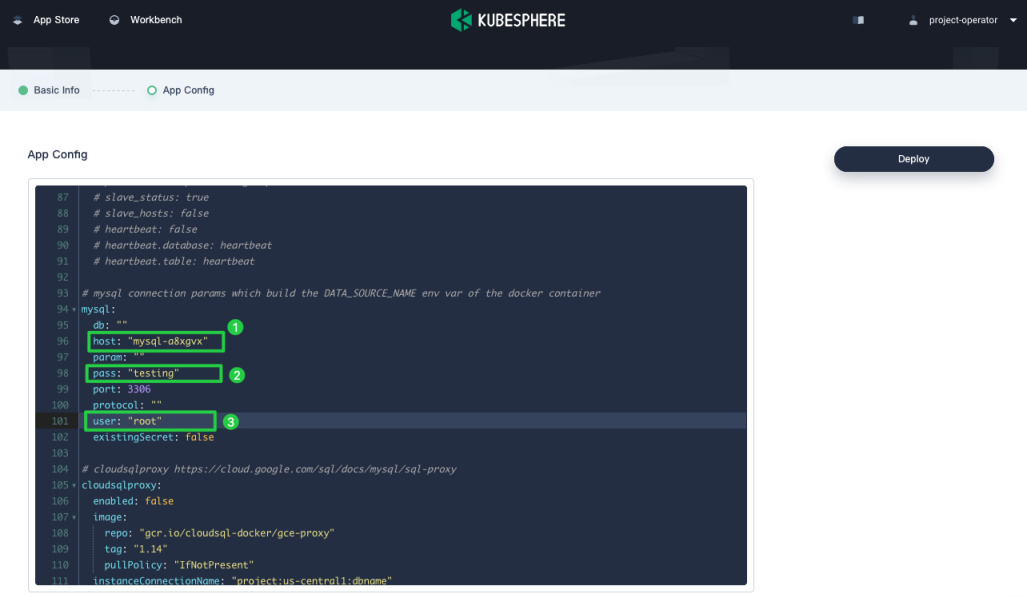
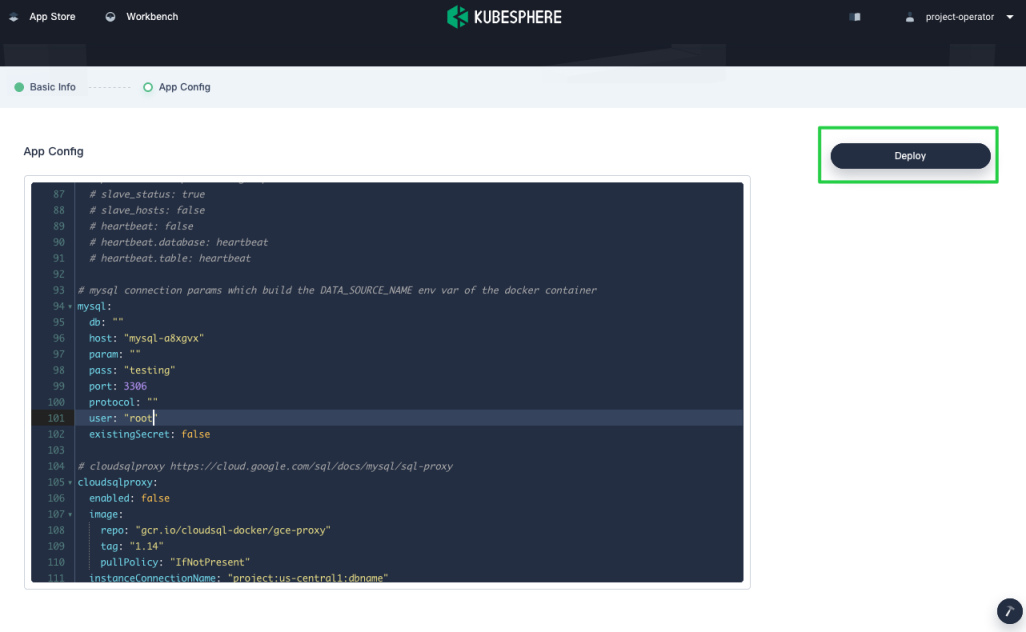
-
Click Deploy and wait until MySQL exporter is up and running.
Step 3: Create a monitoring dashboard
After about two minutes, you can create a monitoring dashboard for MySQL and visualize metrics in real time.
-
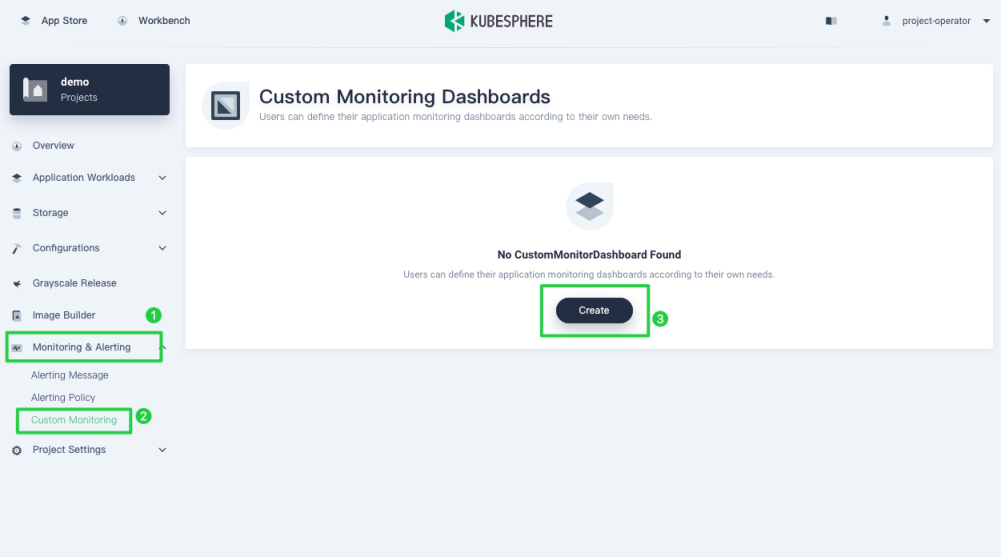
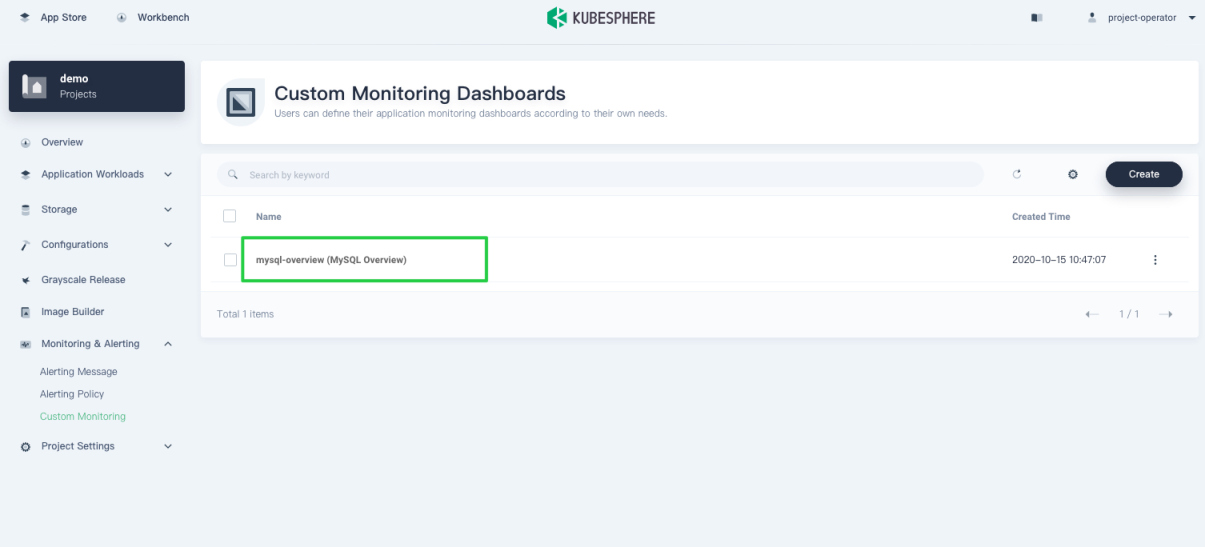
Navigate to Custom Monitoring under Monitoring & Alerting and click Create.
-
In the dialog that appears, name the dashboard
mysql-overviewand choose MySQL template. Click Create to continue.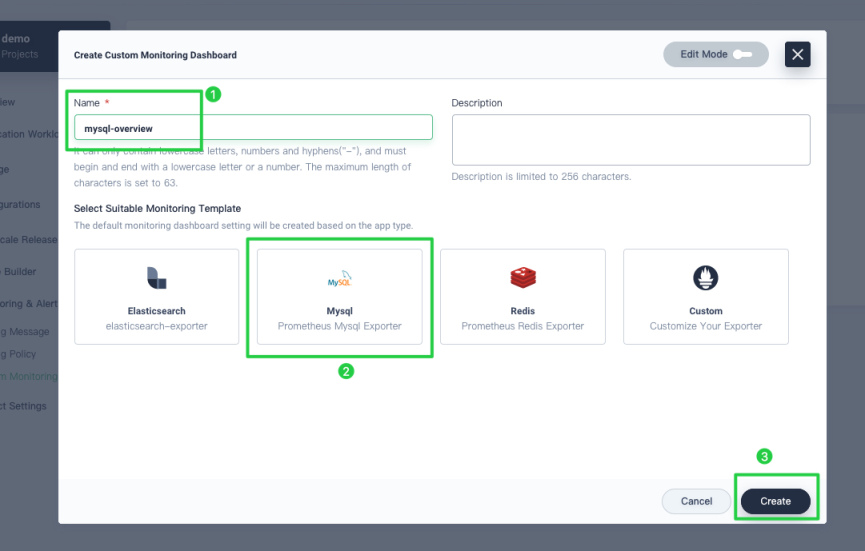
-
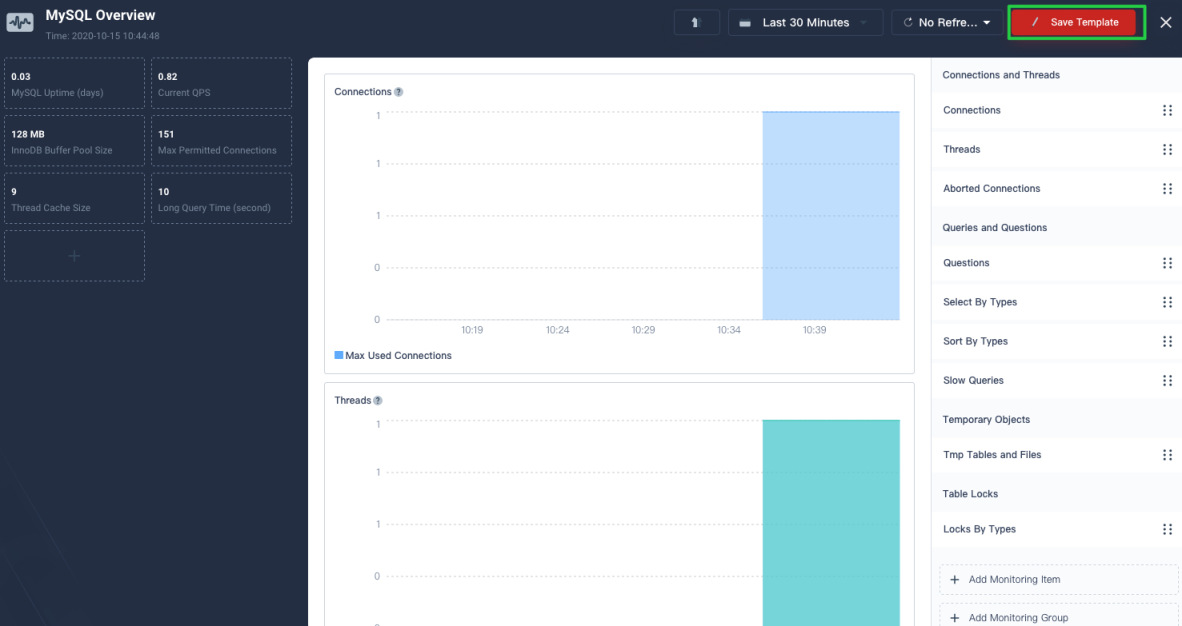
Save the template by clicking Save Template in the top right corner. A newly-created dashboard displays in the dashboard list as below.
Tip
For more information about dashboard properties, see Visualization.
 Previous

What’s on this Page