


You are viewing documentation for KubeSphere version:v3.0.0
KubeSphere v3.0.0 documentation is no longer actively maintained. The version you are currently viewing is a static snapshot. For up-to-date documentation, see the latest version.


Features
Overview
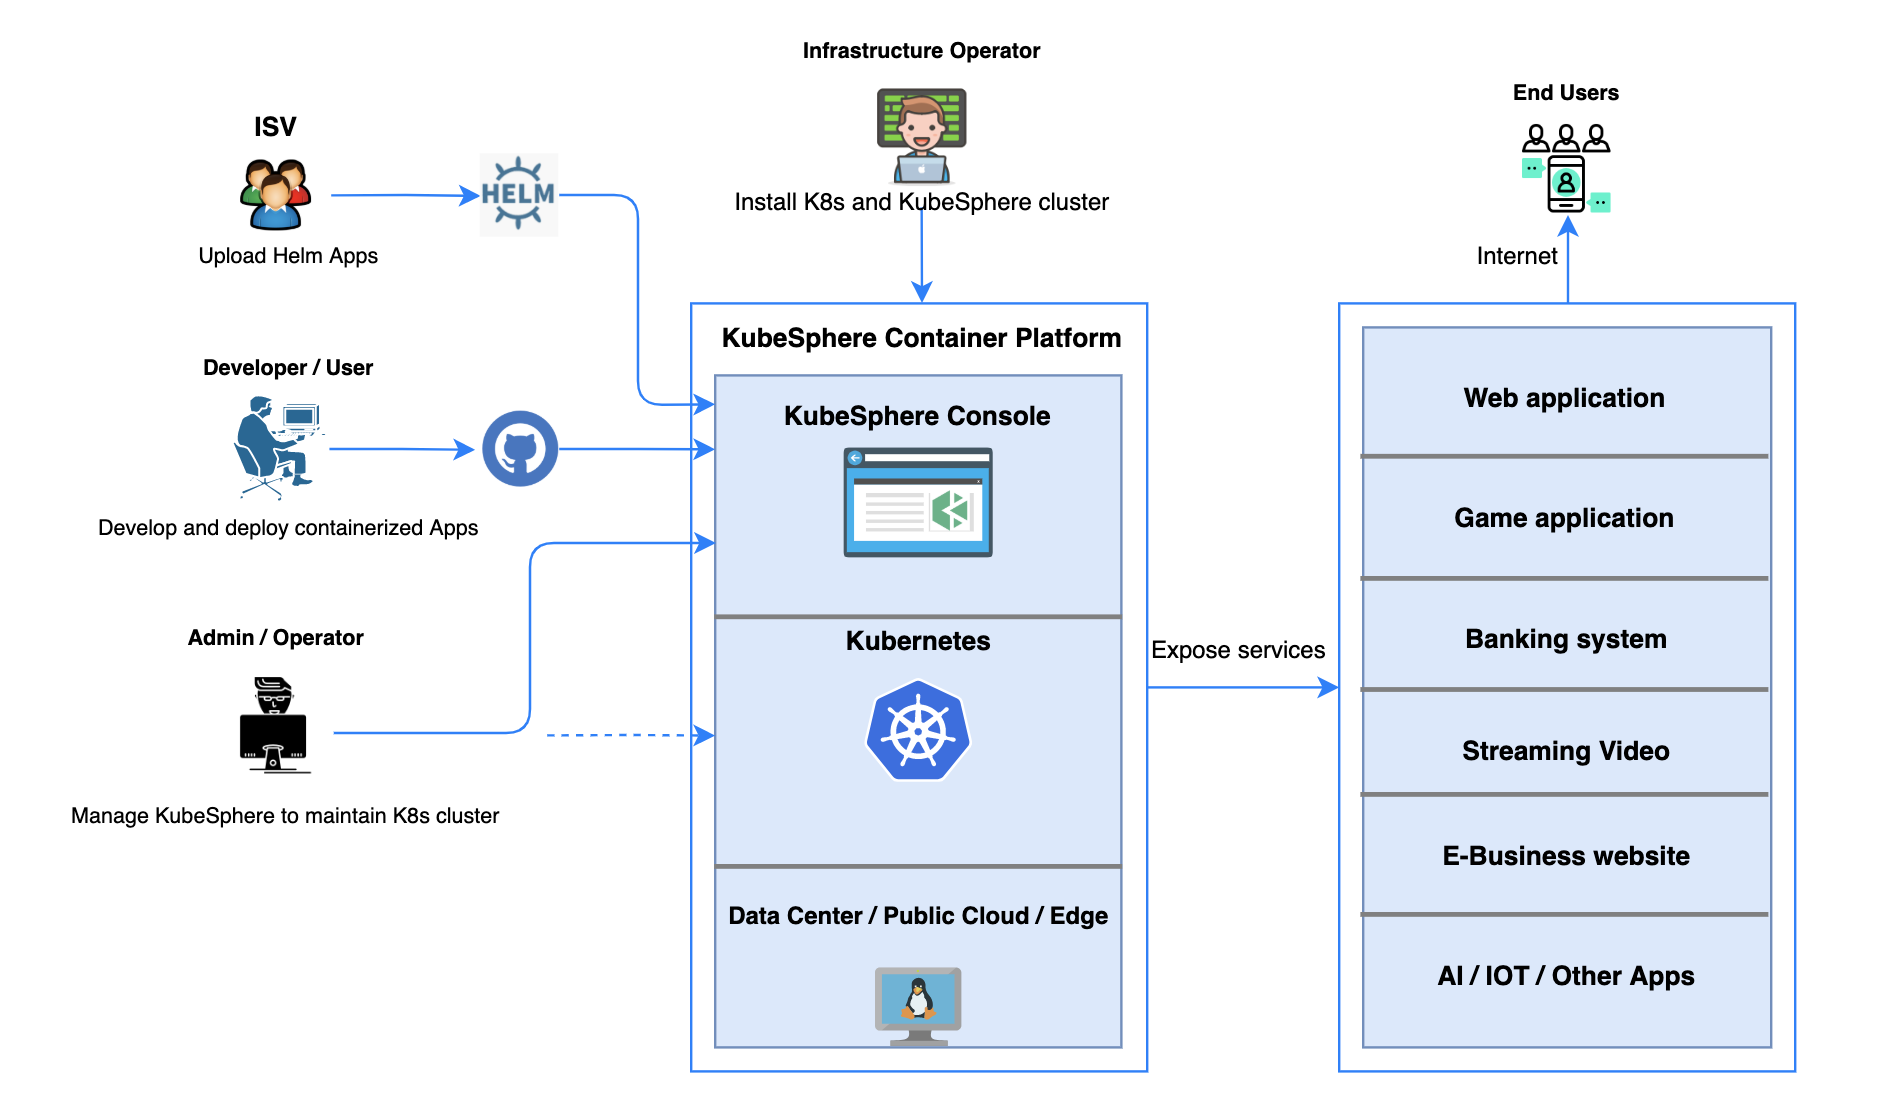
As an open source container platform, KubeSphere provides enterprises with a robust, secure and feature-rich platform, boasting the most common functionalities needed for enterprises adopting Kubernetes, such as multi-cluster deployment and management, network policy configuration, Service Mesh (Istio-based), DevOps projects (CI/CD), security management, Source-to-Image and Binary-to-Image, multi-tenant management, multi-dimensional monitoring, log query and collection, alerting and notification, auditing, application management, and image registry management.
It also supports various open source storage and network solutions, as well as cloud storage services. For example, KubeSphere presents users with a powerful cloud-native tool PorterLB, a CNCF-certified load balancer developed for bare metal Kubernetes clusters.
With an easy-to-use web console in place, KubeSphere eases the learning curve for users and drives the adoption of Kubernetes.
The following modules elaborate on the key features and benefits provided by KubeSphere. For detailed information, see the respective chapter in this guide.
Provisioning and Maintaining Kubernetes
Provisioning Kubernetes Clusters
KubeKey allows you to deploy Kubernetes on your infrastructure out of box, provisioning Kubernetes clusters with high availability. It is recommended that at least three master nodes are configured behind a load balancer for production environment.
Kubernetes Resource Management
KubeSphere provides a graphical web console, giving users a clear view of a variety of Kubernetes resources, including Pods and containers, clusters and nodes, workloads, secrets and ConfigMaps, services and Ingress, jobs and CronJobs, and applications. With wizard user interfaces, users can easily interact with these resources for service discovery, HPA, image management, scheduling, high availability implementation, container health check and more.
As KubeSphere 3.0 features enhanced observability, users are able to keep track of resources from multi-tenant perspectives, such as custom monitoring, events, auditing logs, alerts and notifications.
Cluster Upgrade and Scaling
The next-gen installer KubeKey provides an easy way of installation, management and maintenance. Moreover, it supports rolling upgrades of Kubernetes clusters so that the cluster service is always available while being upgraded. Also, you can add new nodes to a Kubernetes cluster to include more workloads by using KubeKey.
Multi-cluster Management and Deployment
As the IT world sees a growing number of cloud-native applications reshaping software portfolios for enterprises, users tend to deploy their clusters across locations, geographies, and clouds. Against this backdrop, KubeSphere has undergone a significant upgrade to address the pressing need of users with its brand-new multi-cluster feature.
With KubeSphere, users can manage the infrastructure underneath, such as adding or deleting clusters. Heterogeneous clusters deployed on any infrastructure (for example, Amazon EKS and Google Kubernetes Engine) can be managed in a unified way. This is made possible by a central control plane of KubeSphere with two efficient management approaches available.
- Solo. Independently deployed Kubernetes clusters can be maintained and managed together in KubeSphere container platform.
- Federation. Multiple Kubernetes clusters can be aggregated together as a Kubernetes resource pool. When users deploy applications, replicas can be deployed on different Kubernetes clusters in the pool. In this regard, high availability is achieved across zones and clusters.
KubeSphere allows users to deploy applications across clusters. More importantly, an application can also be configured to run on a certain cluster. Besides, the multi-cluster feature, paired with OpenPitrix, an industry-leading application management platform, enables users to manage apps across their whole lifecycle, including release, removal and distribution.
For more information, see Multi-cluster Management.
DevOps Support
KubeSphere provides a pluggable DevOps component based on popular CI/CD tools such as Jenkins. It features automated workflows and tools including binary-to-image (B2I) and source-to-image (S2I) to package source code or binary artifacts into ready-to-run container images.
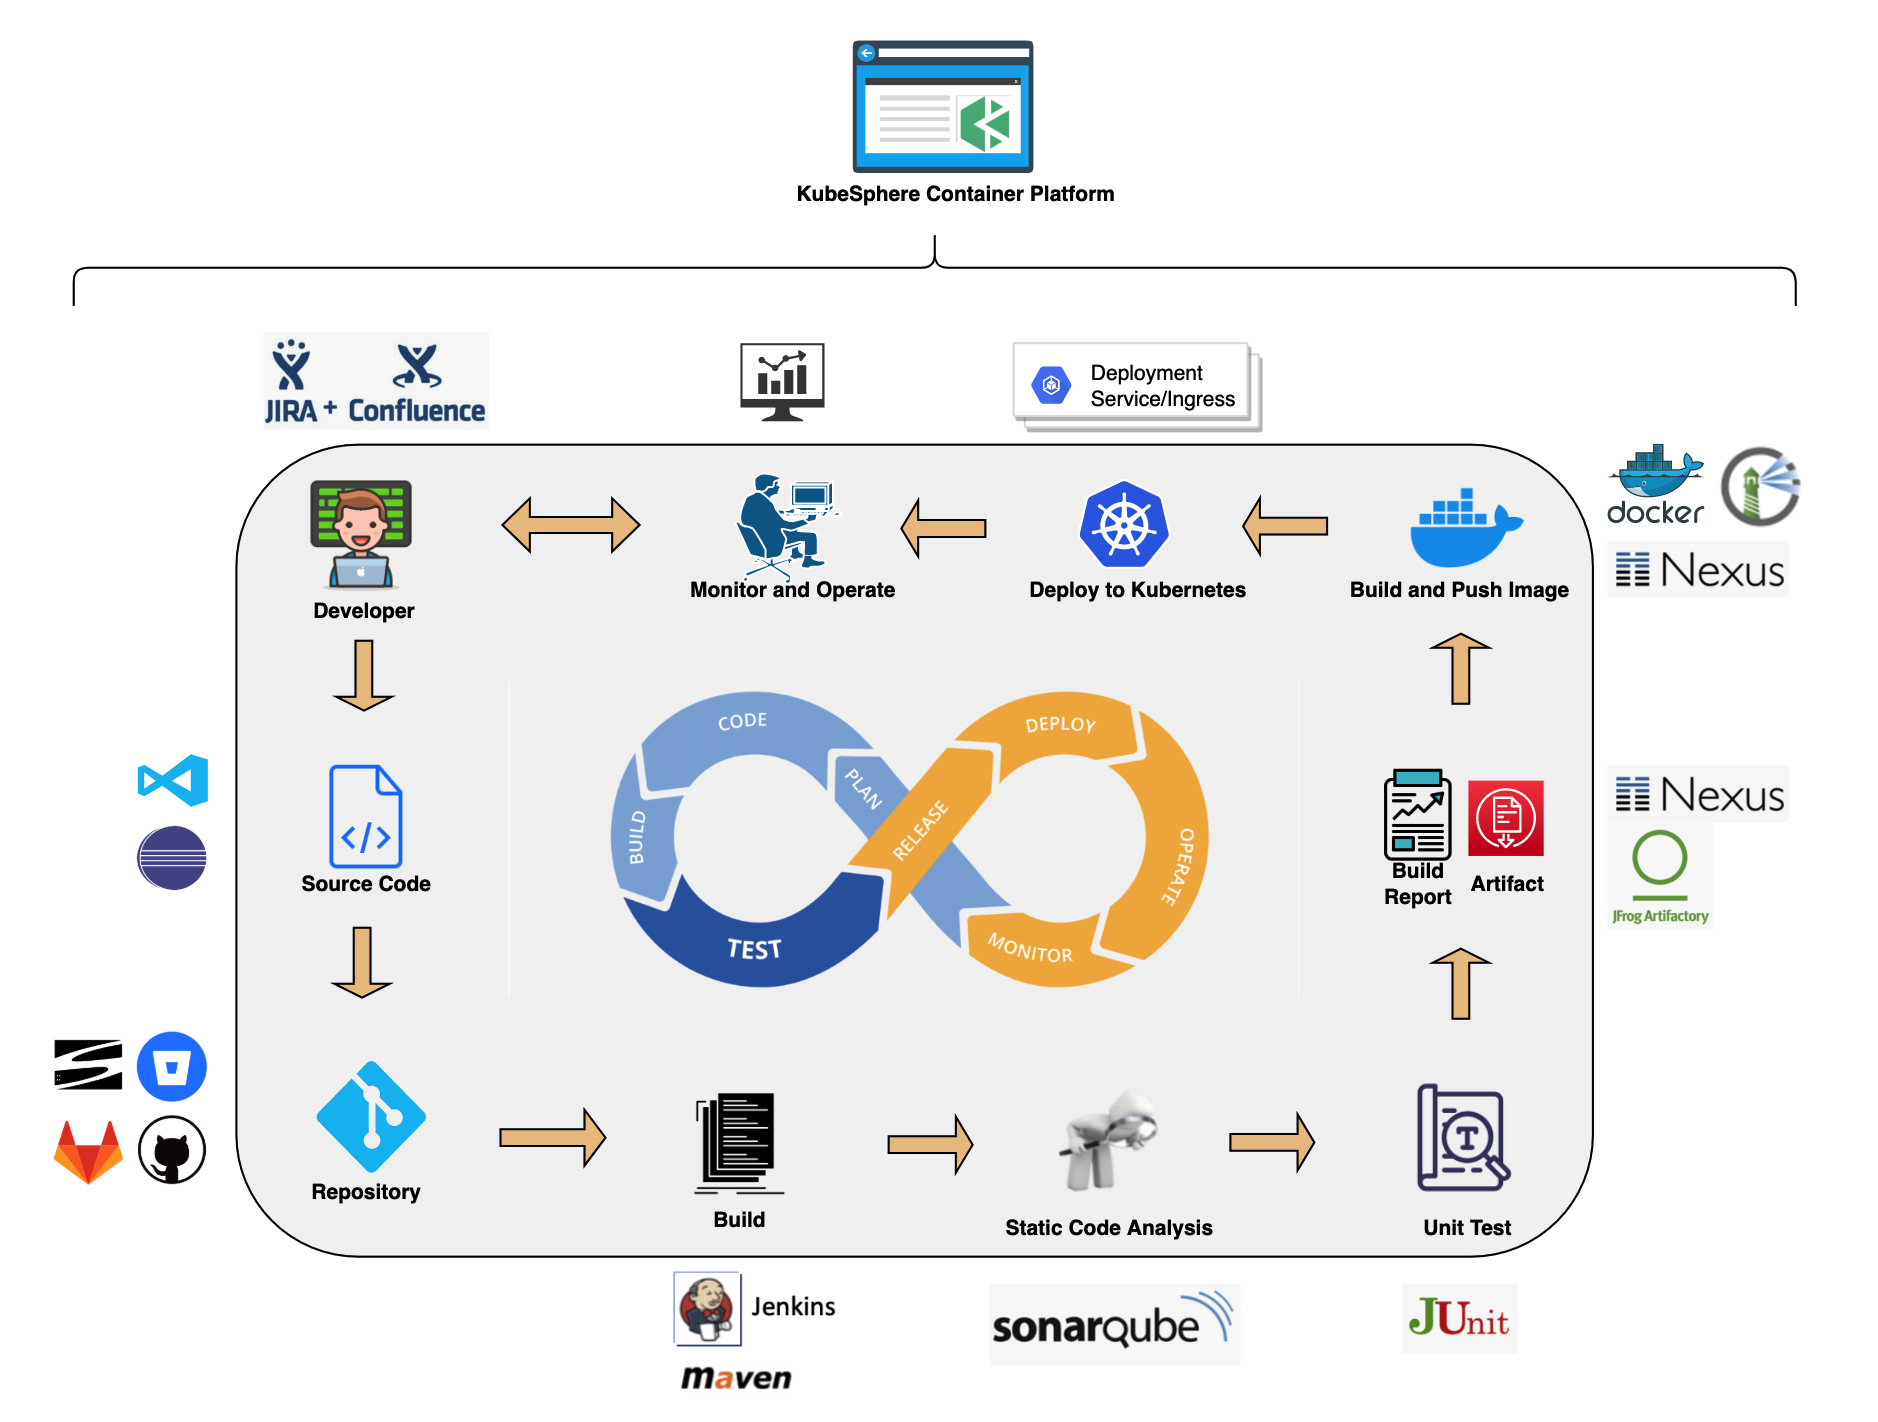
CI/CD Pipeline
- Automation. CI/CD pipelines and build strategies are based on Jenkins, streamlining and automating the development, test and production process. Dependency caches are used to accelerate build and deployment.
- Out-of-box. Users can ship their Jenkins build strategy and client plugin to create a Jenkins pipeline based on Git repository/SVN. They can define any step and stage in the built-in Jenkinsfile. Common agent types are embedded, such as Maven, Node.js and Go. Users can customize the agent type as well.
- Visualization. Users can easily interact with a visualized control panel to set conditions and manage CI/CD pipelines.
- Quality Management. Static code analysis is supported to detect bugs, code smells and security vulnerabilities.
- Logs. The entire running process of CI/CD pipelines is recorded.
Source-to-Image
Source-to-Image (S2I) is a toolkit and automated workflow for building reproducible container images from source code. S2I produces ready-to-run images by injecting source code into a container image and making the container ready to execute from source code.
S2I allows you to publish your service to Kubernetes without writing a Dockerfile. You just need to provide a source code repository address, and specify the target image registry. All configurations will be stored as different resources in Kubernetes. Your service will be automatically published to Kubernetes, and the image will be pushed to the target registry as well.
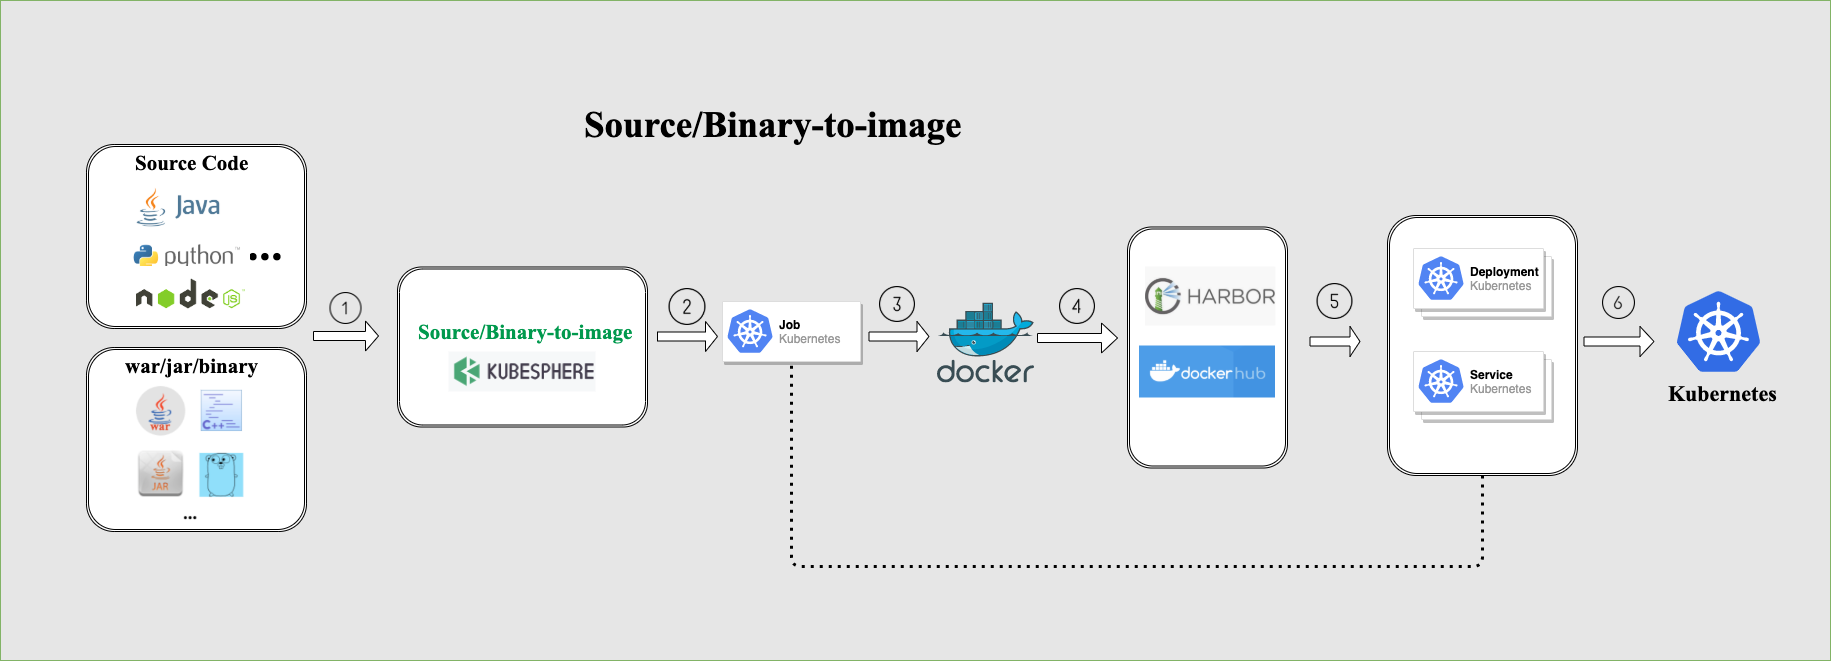
Binary-to-Image
Similar to S2I, Binary-to-Image (B2I) is a toolkit and automated workflow for building reproducible container images from binary (for example, Jar, War, Binary package).
You just need to upload your application binary package, and specify the image registry to which you want to push. The rest is exactly the same as S2I.
For more information, see DevOps Administration.
Istio-based Service Mesh
KubeSphere service mesh is composed of a set of ecosystem projects, such as Istio, Envoy and Jaeger. We design a unified user interface to use and manage these tools. Most features are out-of-box and have been designed from the developer’s perspective, which means KubeSphere can help you to reduce the learning curve since you do not need to deep dive into those tools individually.
KubeSphere service mesh provides fine-grained traffic management, observability, tracing, and service identity and security management for a distributed application. Therefore, developers can focus on core business. With service mesh management of KubeSphere, users can better track, route and optimize communications within Kubernetes for cloud-native apps.
Traffic Management
- Canary release represents an important deployment strategy of new versions for testing purposes. Traffic is separated with a pre-configured ratio into a canary release and a production release respectively. If everything goes well, users can change the percentage and gradually replace the old version with the new one.
- Blue-green deployment allows users to run two versions of an application at the same time. Blue stands for the current app version and green represents the new version tested for functionality and performance. Once the testing results are successful, application traffic is routed from the in-production version (blue) to the new one (green).
- Traffic mirroring enables teams to bring changes to production with as little risk as possible. Mirroring sends a copy of live traffic to a mirrored service.
- Circuit breaker allows users to set limits for calls to individual hosts within a service, such as the number of concurrent connections or how many times calls to this host have failed.
For more information, see Grayscale Release.
Visualization
KubeSphere service mesh has the ability to visualize the connections between microservices and the topology of how they interconnect. In this regard, observability is extremely useful in understanding the interconnection of cloud-native microservices.
Distributed Tracing
Based on Jaeger, KubeSphere service mesh enables users to track how services interact with each other. It helps users gain a deeper understanding of request latency, bottlenecks, serialization and parallelism via visualization.
Multi-tenant Management
In KubeSphere, resources (for example, clusters) can be shared between tenants. First, administrators or managers need to set different account roles with different authorizations. After that, members in the platform can be assigned with these roles to perform specific actions on varied resources. Meanwhile, as KubeSphere completely isolates tenants, they will not affect each other at all.
- Multi-tenancy. It provides role-based fine-grained authentication in a unified way and a three-tier authorization system.
- Unified authentication. For enterprises, KubeSphere is compatible with their central authentication system that is base on LDAP or AD protocol. Single sign-on (SSO) is also supported to achieve unified authentication of tenant identity.
- Authorization system. It is organized into three levels: cluster, workspace and project. KubeSphere ensures resources can be shared while different roles at multiple levels are completely isolated for resource security.
For more information, see Role and Member Management in Workspace.
Observability
Multi-dimensional Monitoring
KubeSphere features a self-updating monitoring system with graphical interfaces that streamline the whole process of operation and maintenance. It provides customized monitoring of a variety of resources and includes a set of alerts that can immediately notify users of any occurring issues.
-
Customized monitoring dashboard. Users can decide exactly what metics need to be monitored in what kind of form. Different templates are available in KubeSphere for users to select, such as Elasticsearch, MySQL, and Redis. Alternatively, they can also create their own monitoring templates, including charts, colors, intervals and units.
-
O&M-friendly. The monitoring system can be operated in a visualized interface with open standard APIs for enterprises to integrate their existing systems. Therefore, they can implement operation and maintenance in a unified way.
-
Third-party compatibility. KubeSphere is compatible with Prometheus, which is the de facto metrics collection platform for monitoring in Kubernetes environments. Monitoring data can be seamlessly displayed in the web console of KubeSphere.
-
Multi-dimensional monitoring at second-level precision.
- For infrastructure monitoring, the system provides comprehensive metrics such as CPU utilization, memory utilization, CPU load average, disk usage, inode utilization, disk throughput, IOPS, network outbound/inbound rate, Pod status, ETCD service status, and API Server status.
- For application resource monitoring, the system provides five key monitoring metrics: CPU utilization, memory consumption, Pod number, network outbound and inbound rate. Besides, users can sort data based on resource consumption and search metics by customizing the time range. In this way, occurring problems can be quickly located so that users can take necessary action.
-
Ranking. Users can sort data by node, workspace and project, which gives them a graphical view of how their resources are running in a straightforward way.
-
Component monitoring. It allows users to quickly locate any component failures to avoid unnecessary business downtime.
Alerting, Events, Auditing and Notifications
- Customized alerting policies and rules. The alerting system is based on multi-tenant monitoring of multi-dimensional metrics. The system will send alerts related to a wide spectrum of resources such as pod, network and workload. In this regard, users can customize their own alerting policy by setting specific rules, such as repetition interval and time. The threshold and alerting level can also be defined by users themselves.
- Accurate event tracking. KubeSphere allows users to know what is happening inside a cluster, such as container running status (successful or failed), node scheduling, and image pulling result. They will be accurately recorded with the specific reason, status and message displayed in the web console. In a production environment, this will help users to respond to any issues in time.
- Enhanced auditing security. As KubeSphere features fine-grained management of user authorization, resources and network can be completely isolated to ensure data security. The comprehensive auditing feature allows users to search for activities related to any operation or alert.
- Diversified notification methods. Emails represent a key approach for users to receive notifications of relevant activities they want to know. They can be sent based on the rule set by users themselves, who are able to customize the sender email address and their receiver lists. Besides, other channels, such as Slack and WeChat, are also supported to meet the need of our users. In this connection, KubeSphere provides users with more notification preferences as they are updated on the latest development in KubeSphere no matter what channel they select.
For more information, please see Project Administration and Usage.
Log Query and Collection
- Multi-tenant log management. In KubeSphere log search system, different tenants can only see their own log information. Logs can be exported as records for future reference.
- Multi-level log query. Users can search for logs related to various resources, such as projects, workloads, and pods. Flexible and convenient log collection configuration options are available.
- Multiple log collectors. Users can choose log collectors such as Elasticsearch, Kafka, and Fluentd.
- On-disk log collection. For applications whose logs are saved in a Pod sidecar as a file, users can enable Disk Log Collection.
Application Management and Orchestration
- App Store. KubeSphere provides an app store based on OpenPitrix, an industry-leading open source system for app management across the whole lifecycle, including release, removal, and distribution.
- App repository. In KubeSphere, users can create an app repository hosted either in object storage (such as QingStor or AWS S3) or in GitHub. App packages submitted to the app repository are composed of Helm Chart template files of the app.
- App template. With app templates, KubeSphere provides a visualized way for app deployment with just one click. Internally, app templates can help different teams in the enterprise to share middleware and business systems. Externally, they can serve as an industry standard for application delivery based on different scenarios and needs.
Multiple Storage Solutions
- Open source storage solutions are available such as GlusterFS, CephRBD, and NFS.
- NeonSAN CSI plugin connects to QingStor NeonSAN to meet core business requirements for low latency, high resilience, and high performance.
- QingCloud CSI plugin connects to various block storage services in QingCloud platform.
Multiple Network Solutions
-
Open source network solutions are available such as Calico and Flannel.
-
PorterLB, a load balancer developed for bare metal Kubernetes clusters, is designed by KubeSphere development team. This CNCF-certified tool serves as an important solution for developers. It mainly features:
- ECMP routing load balancing
- BGP dynamic routing configuration
- VIP management
- LoadBalancerIP assignment in Kubernetes services (v0.3.0)
- Installation with Helm Chart (v0.3.0)
- Dynamic BGP server configuration through CRD (v0.3.0)
- Dynamic BGP peer configuration through CRD (v0.3.0)
For more information, please see this article.
 Previous

What’s on this Page