


You are viewing documentation for KubeSphere version:v3.0.0
KubeSphere v3.0.0 documentation is no longer actively maintained. The version you are currently viewing is a static snapshot. For up-to-date documentation, see the latest version.


Log Query
The logs of applications and systems can help you better understand what is happening inside your cluster and workloads. The logs are particularly useful for debugging problems and monitoring cluster activities. KubeSphere provides a powerful and easy-to-use logging system which offers users the capabilities of log collection, query and management from the perspective of tenants. The tenant-based logging system is much more useful than Kibana since different tenants can only view their own logs, leading to better security. Moreover, the KubeSphere logging system filters out some redundant information so that tenants can only focus on logs that are useful to them.
This tutorial demonstrates how to use the log query function, including the interface, search parameters and detail pages.
Prerequisites
You need to enable the KubeSphere Logging System.
Enter the Log Query Interface
-
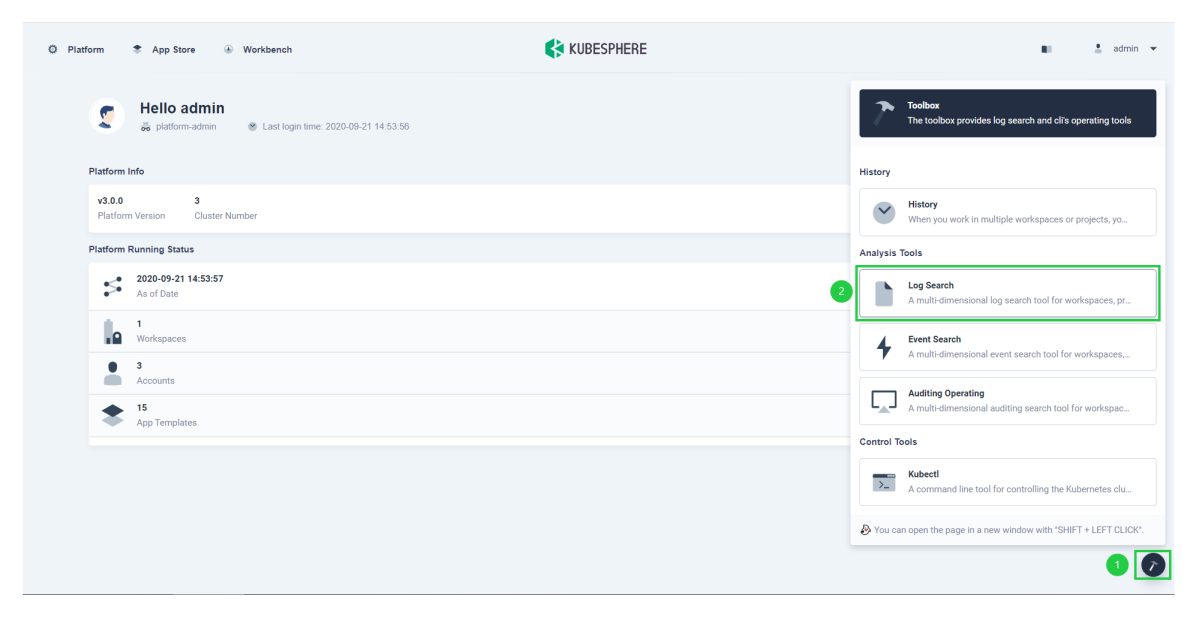
The log query function is available for all users. Log in to the console with any account, hover over the Toolbox in the lower right corner and select Log Search.
-
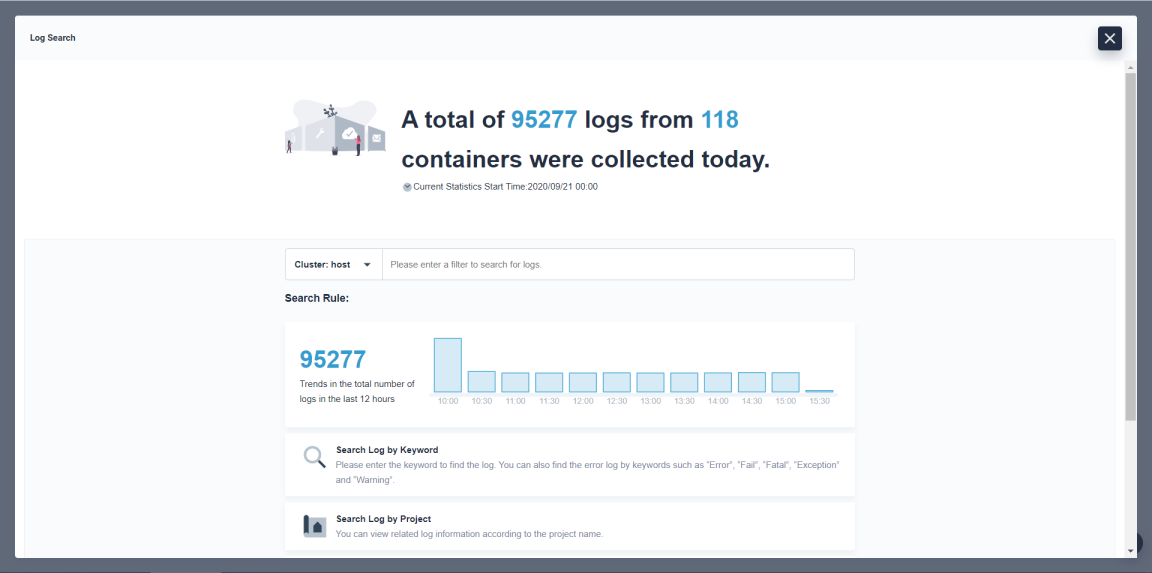
As shown in the pop-up window, you can see a time histogram of log numbers, a cluster selection drop-down list and a log search bar.
Note
- KubeSphere supports log queries on each cluster separately if you have enabled the multi-cluster feature. You can switch the target cluster using the drop-down list next to the log search bar.
- Supported fields in the log search bar:
- Keyword
- Project
- Workload
- Pod
- Container
- Time Range
- The keyword field supports the query of keyword combinations. For example, you can use
Error,Fail,Fatal,Exception, andWarningtogether to query all the exception logs. - The keyword field supports exact query and fuzzy query. The fuzzy query provides case-insensitive fuzzy matching and retrieval of full terms by the first half of a word or phrase based on the ElasticSearch segmentation rules. For example, you can retrieve the logs containing
node_cpu_totalby searching the keywordnode_cpuinstead of the keywordcpu.
-
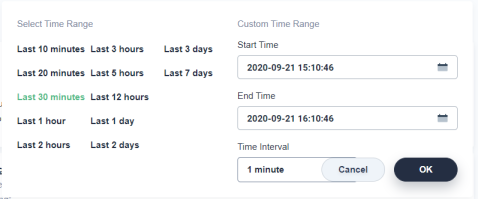
You can customize the query time range by selecting Time Range in the log search bar. Alternatively, click on the bars in the time histogram, and KubeSphere will use the time range of that bar for log queries.
Note
- KubeSphere stores logs for last seven days by default.
- Each cluster has its own log retention period which can be set separately. You can modify it in
ClusterConfiguration. Refer to KubeSphere Logging System for more details.
Use Search Parameters
-
You can provide as many fields as possible to narrow down your search results. Below is an example of a log query on the cluster
productwith the keyworderrorin the projectkubesphere-systemwithinlast 12 hours.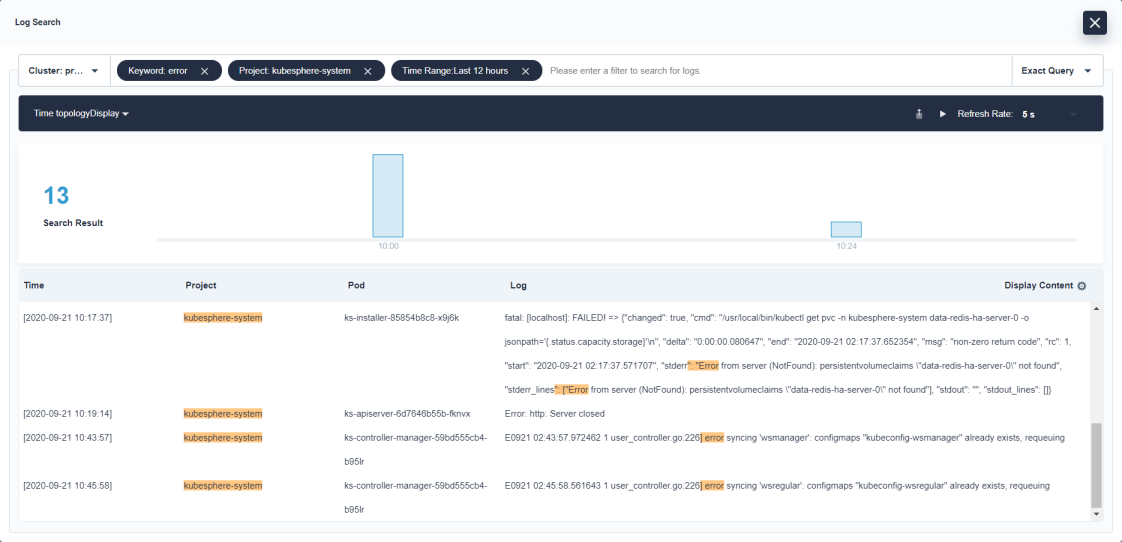
-
It returns logs of 13 rows with the corresponding time, project, pod and container information all displayed.
-
Click any one of the results from the list. Drill into its detail page and inspect the log from this Pod, including the complete context on the right. It is convenient for developers in terms of debugging and analyzing.
Note
The log query interface supports dynamic refreshing with 5s, 10s or 15s, and allows users to export logs to a local file for further analysis (in the top-right corner).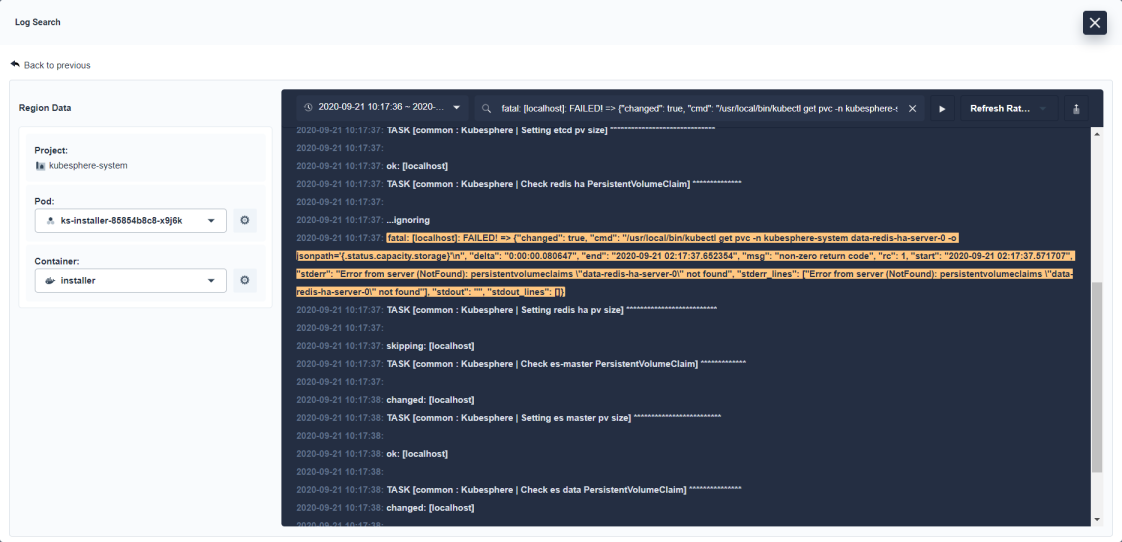
-
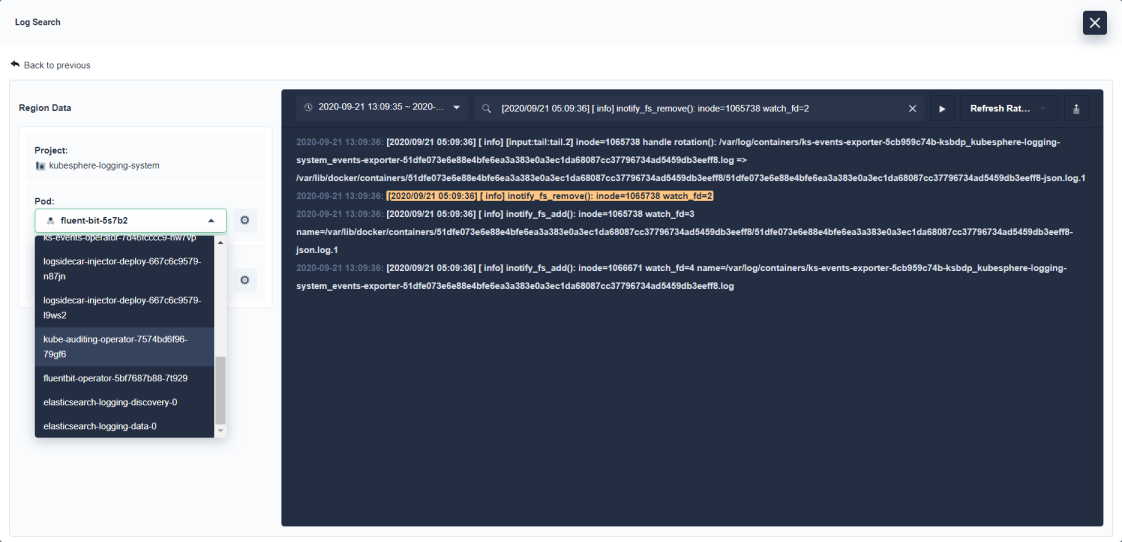
As you can see from the left panel, you can switch between Pods and inspect its containers within the same project from the drop-down list. In this case, you can detect if any abnormal Pods affect other Pods.
Drill into the Detail Page
-
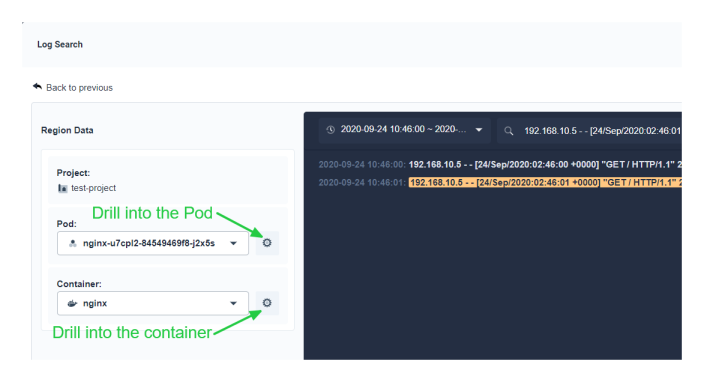
If the log looks abnormal, you can drill into the Pod detail page or container detail page to further inspect container logs, resource monitoring graphs and events.
-
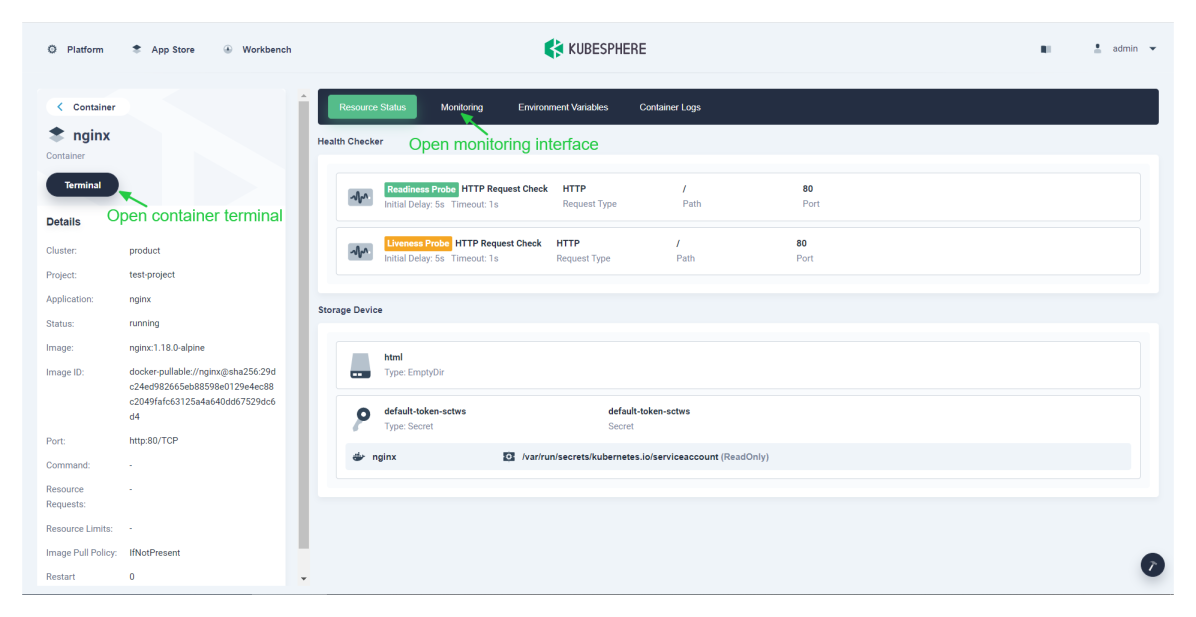
Inspect the container detail page as follows. At the same time, it allows you to open the terminal to debug the container directly.
 Previous

What’s on this Page