


You are viewing documentation for KubeSphere version:v3.0.0
KubeSphere v3.0.0 documentation is no longer actively maintained. The version you are currently viewing is a static snapshot. For up-to-date documentation, see the latest version.


Cluster Status Monitoring
KubeSphere provides monitoring of related metrics such as CPU, memory, network, and disk of the cluster. You can also review historical monitoring data and sort nodes by different indicators based on their usage in Cluster Status Monitoring.
Prerequisites
You need an account granted a role including the authorization of Clusters Management. For example, you can log in to the console as admin directly or create a new role with the authorization and assign it to an account.
Cluster Status Monitoring
-
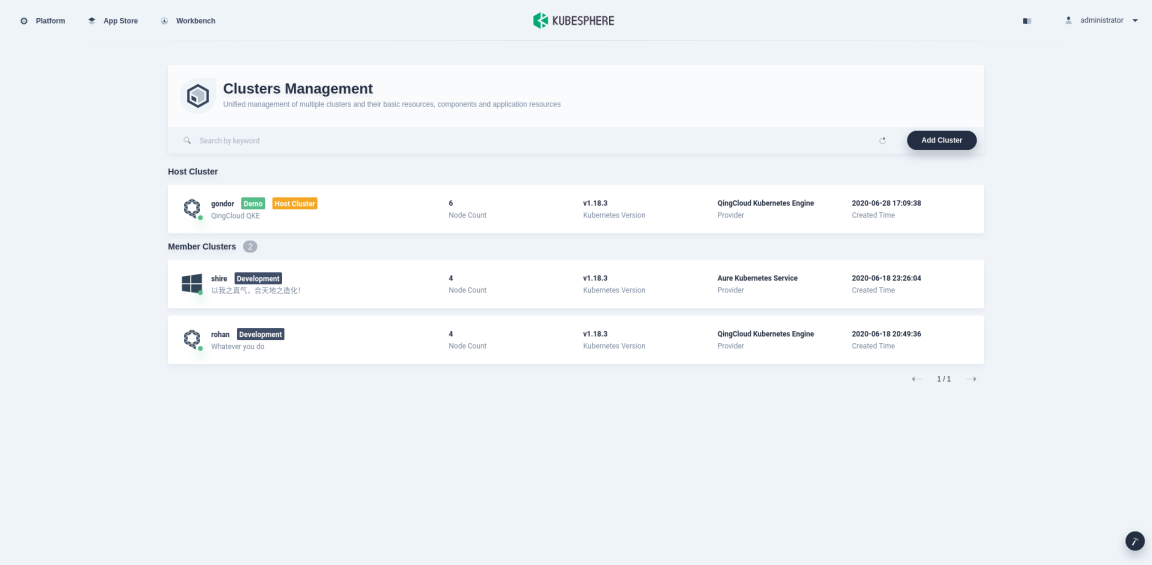
Click Platform in the top left corner and select Clusters Management.
-
If you have enabled the multi-cluster feature with member clusters imported, you can select a specific cluster to view its application resources. If you have not enabled the feature, refer to the next step directly.
-
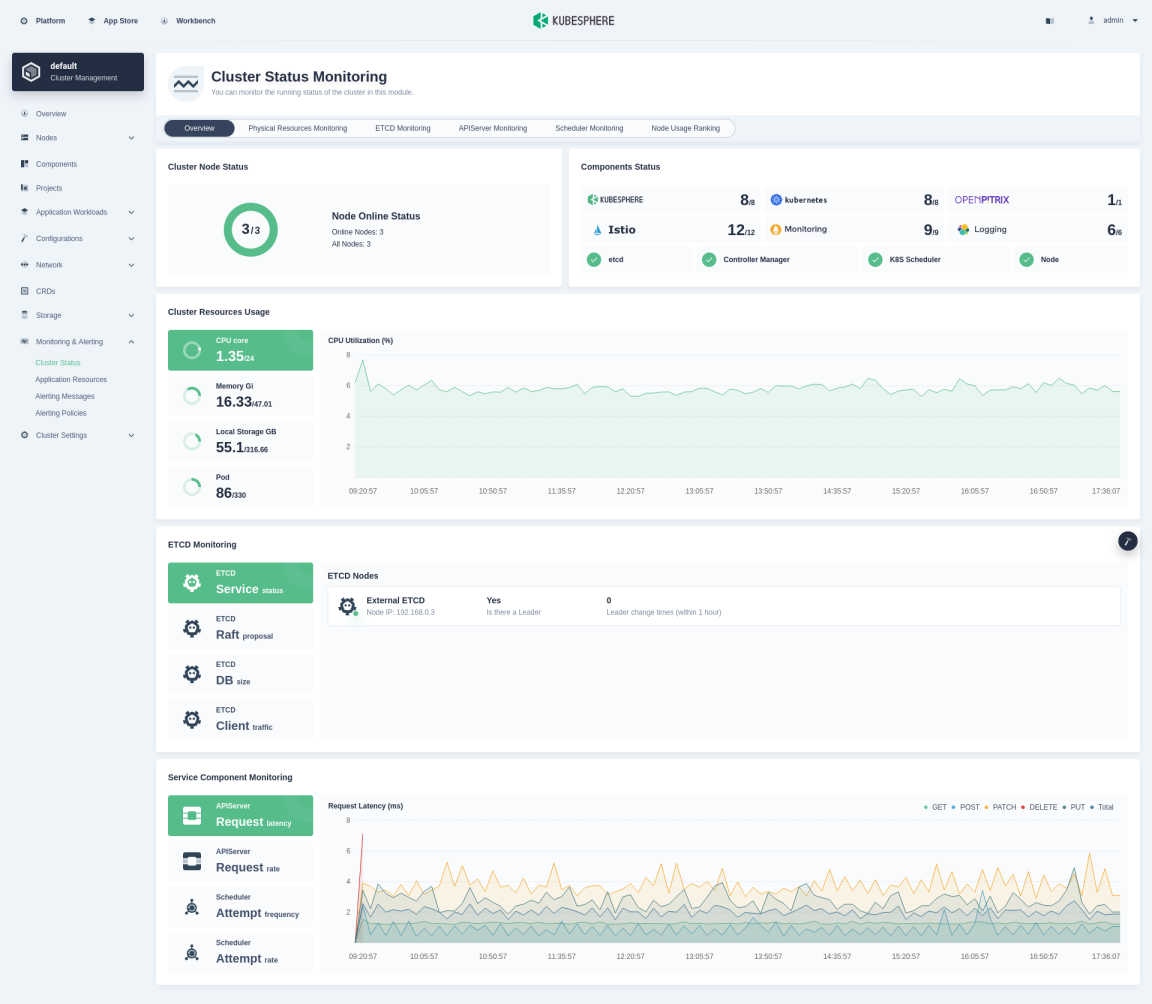
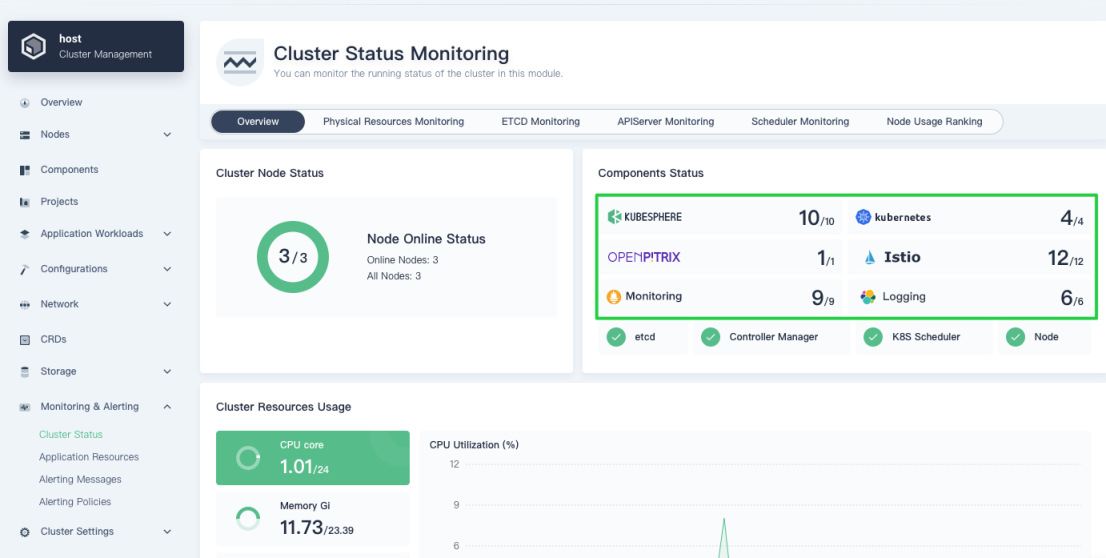
Choose Cluster Status under Monitoring & Alerting to see the overview of cluster status monitoring, including Cluster Node Status, Components Status, Cluster Resources Usage, ETCD Monitoring, and Service Component Monitoring, as shown in the following figure.
Cluster node status
-
Cluster Node Status displays the status of all nodes, separately marking the active ones. You can go to the Cluster Nodes page shown below to view the real-time resource usage of all nodes by clicking Node Online Status.

-
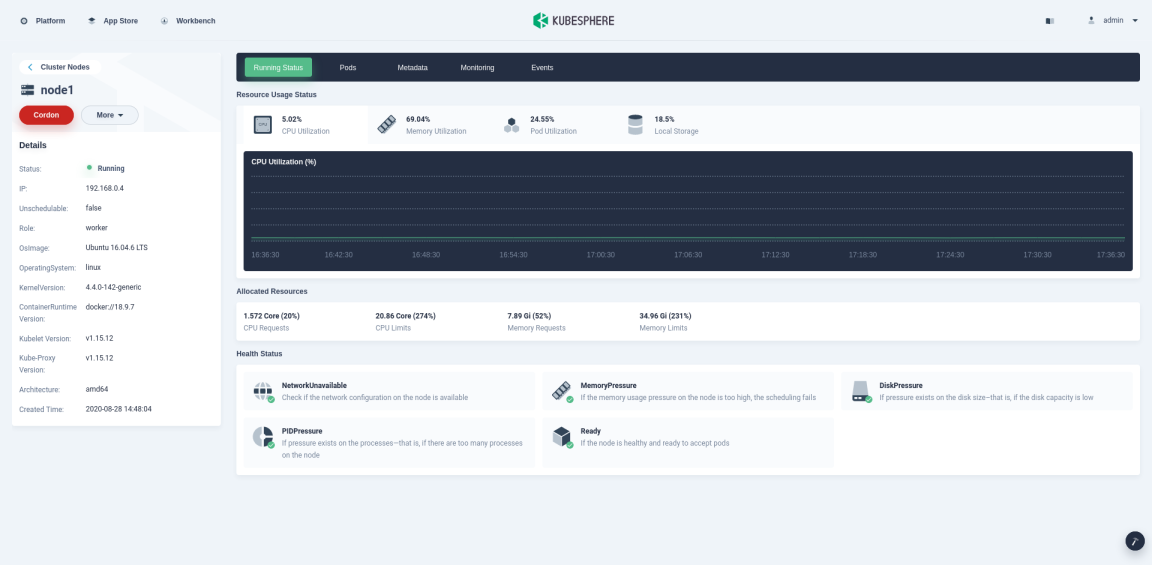
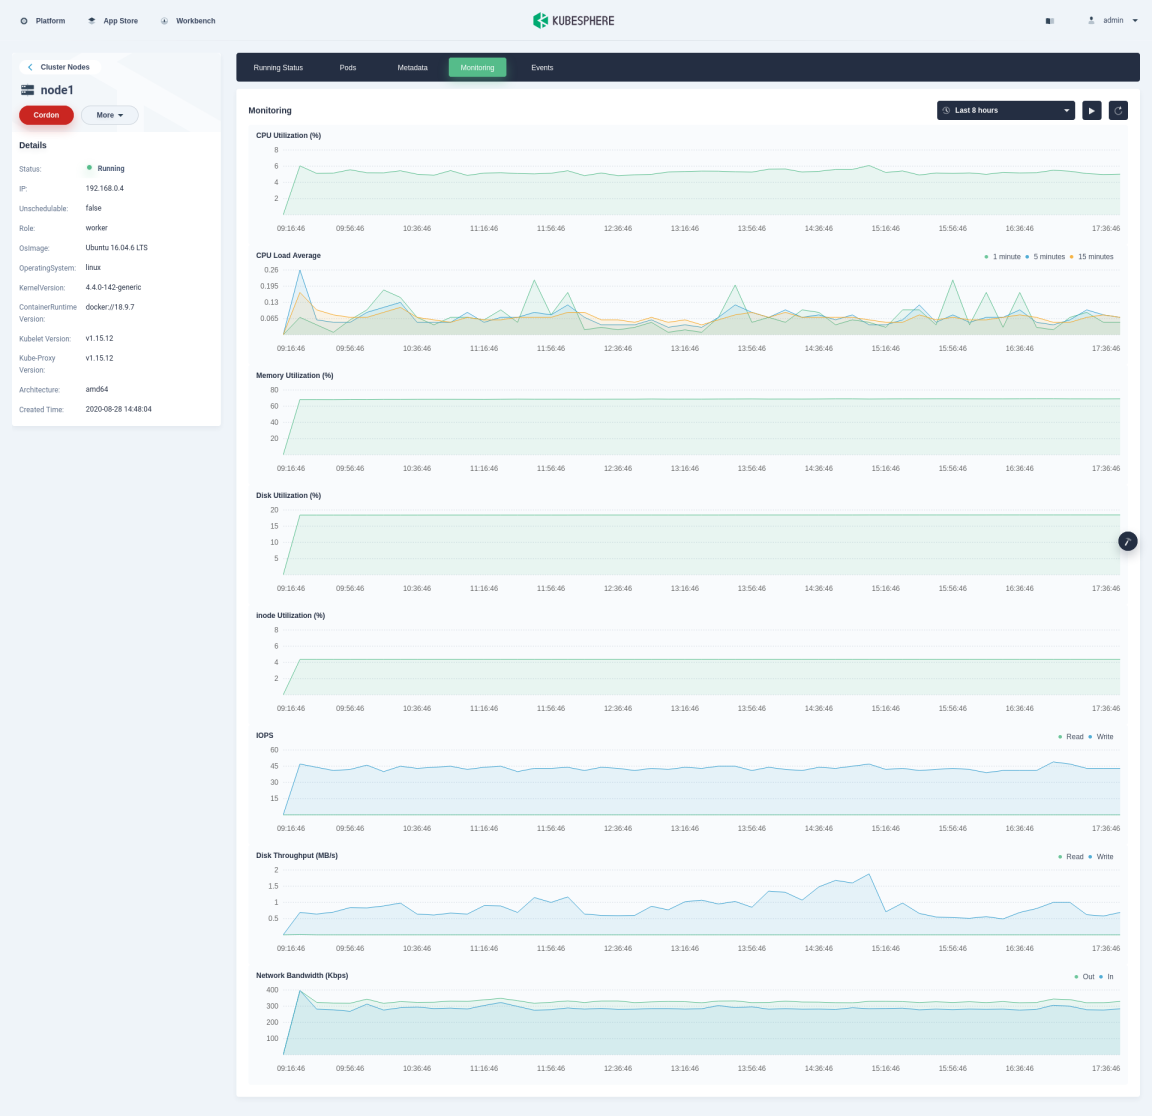
In Cluster Nodes, click the node name to view usage details in Running Status, including the information of CPU, Memory, Pod, Local Storage in the current node, and its health status.
-
Click the tab Monitoring to view how the node is functioning during a certain period based on different metrics, including CPU Utilization, CPU Load Average, Memory Utilization, Disk Utilization, inode Utilization, IOPS, DISK Throughput, and Network Bandwidth, as shown in the following figure.
Tip
You can customize the time range from the drop-down list in the top right corner to view historical data.
Component status
KubeSphere monitors the health status of various service components in the cluster. When a key component malfunctions, the system may become unavailable. The monitoring mechanism of KubeSphere ensures the platform can notify tenants of any occurring issues in case of a component failure, so that they can quickly locate the problem and take corresponding action.
-
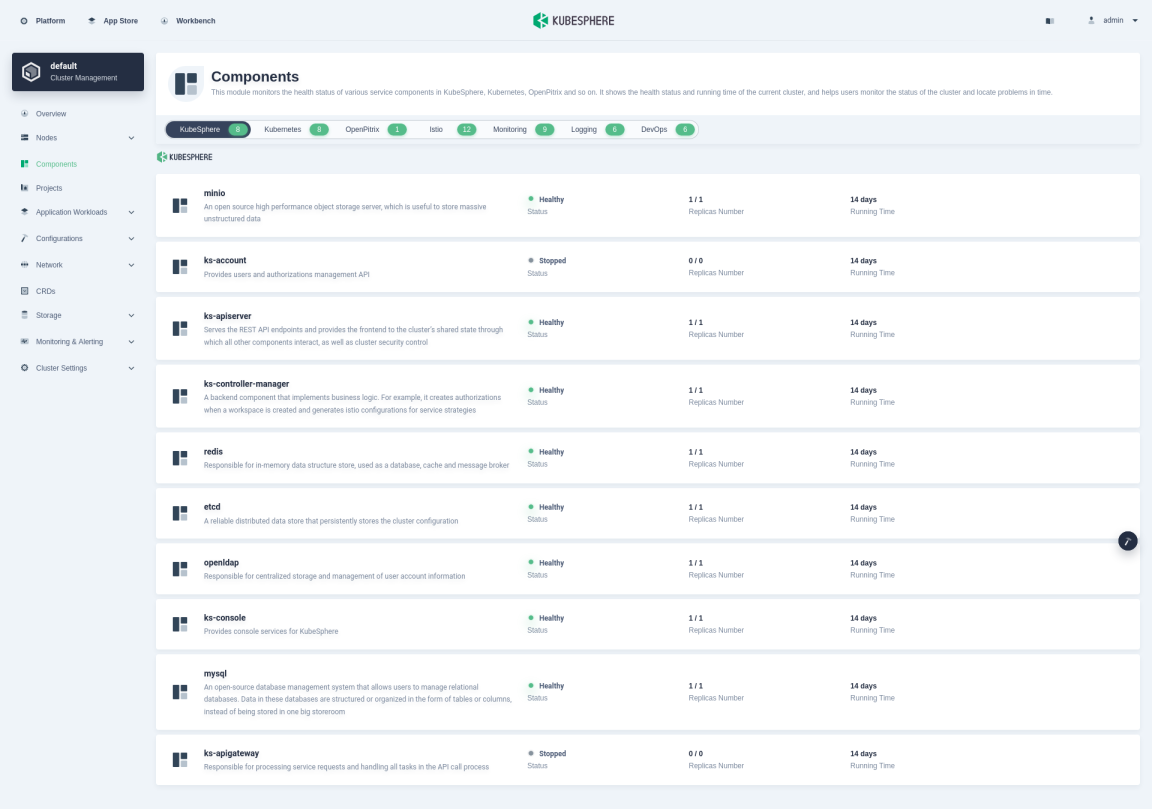
On the Cluster Status Monitoring page, click components (the part in the green box below) under Components Status to view the status of service components.
-
You can see all the components are listed in this part. Components marked in green are those functioning normally while those marked in orange require special attention as it signals potential issues.
Tip
Components marked in orange may turn to green after a period of time, the reasons of which may be different, such as image pulling retries or pod recreations. You can click the component to see its service details.
Cluster resources usage
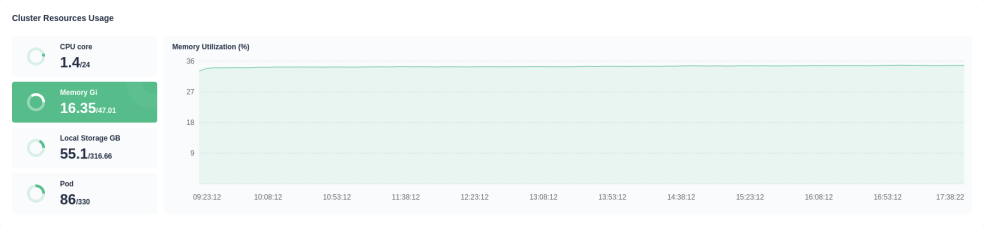
Cluster Resources Usage displays the information including CPU Utilization, Memory Utilization, Disk Utilization, and Pod Quantity Trend of all nodes in the cluster. Click the pie chart on the left to switch indicators, which shows the trend during a period in a line chart on the right.
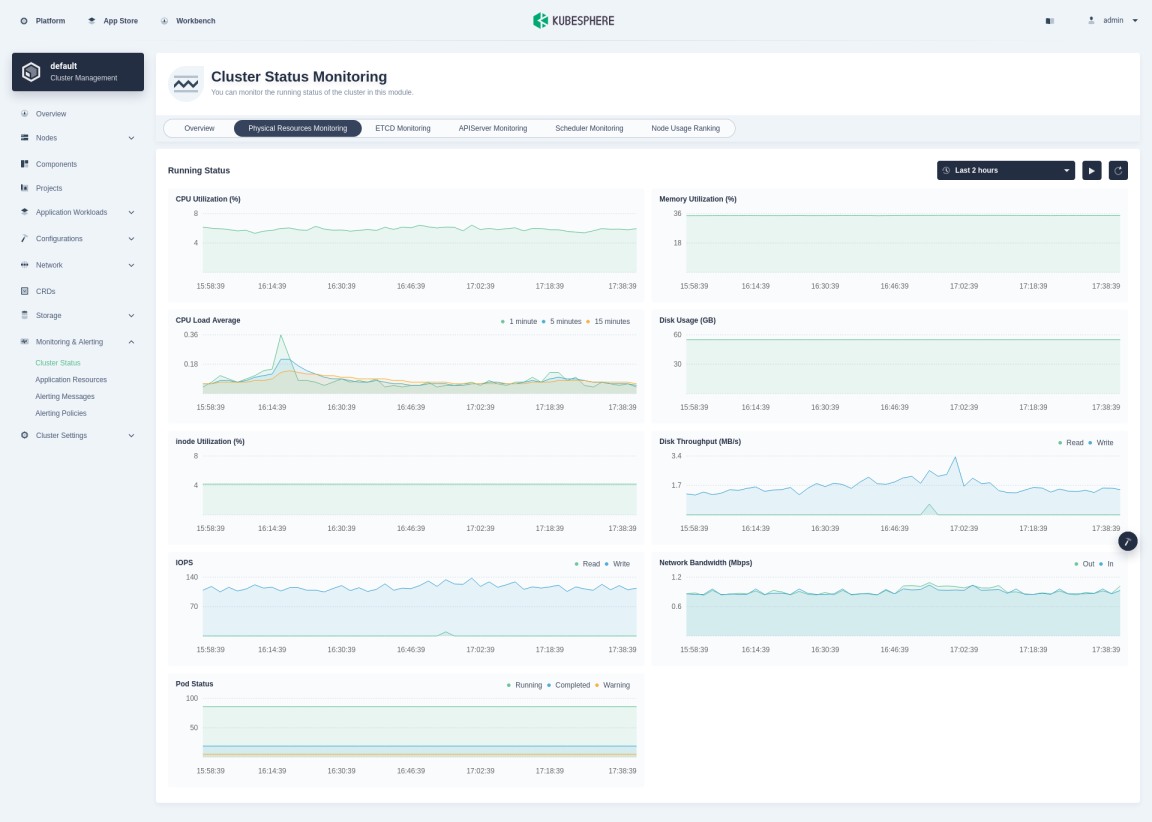
Physical Resources Monitoring
Monitoring data in Physical Resources Monitoring help users better observe their physical resources and establish normal standards for resource and cluster performance. KubeSphere allows users to view cluster monitoring data within the last 7 days, including CPU Utilization, Memory Utilization, CPU Load Average (1 minute/5 minutes/15 minutes), inode Utilization, Disk Throughput (read/write), IOPS (read/write), Network Bandwidth, and Pod Status. You can customize the time range and time interval to view historical monitoring data of physical resources in KubeSphere. The following sections briefly introduce each monitoring indicator.
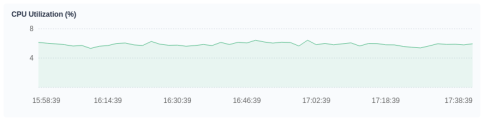
CPU utilization
CPU utilization shows how CPU resources are used in a period. If you notice that the CPU usage of the platform during a certain period soars, you must first locate the process that is occupying CPU resources the most. For example, for Java applications, you may expect a CPU usage spike in the case of memory leaks or infinite loops in the code.
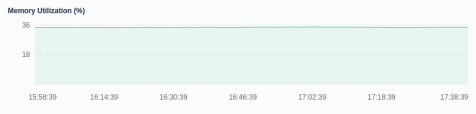
Memory utilization
Memory is one of the important components on a machine, serving as a bridge for communications with the CPU. Therefore, the performance of memory has a great impact on the machine. Data loading, thread concurrency and I/O buffering are all dependent on memory when a program is running. The size of available memory determines whether the program can run normally and how it is functioning. Memory utilization reflects how memory resources are used within a cluster as a whole, displayed as a percentage of available memory in use at a given moment.
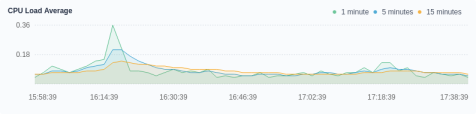
CPU load average
CPU load average is the average number of processes in the system in a runnable state and an uninterruptible state per unit time. Namely, it is the average number of active processes. Note that there is no direct relation between the CPU load average and the CPU utilization. Ideally, the load average should be equal to the number of CPUs. Therefore, you need to consider the number of CPUs when you look into the load average. A system is overloaded only when the load average is greater than the number of CPUs.
KubeSphere provides users with three different time periods to view the load average: 1 minute, 5 minutes and 15 minutes. Normally, it is recommended that you review all of them to gain a comprehensive understanding of load averages:
- If the curves of 1 minute / 5 minutes / 15 minutes are similar within a certain period, it indicates that the CPU load of the cluster is relatively stable.
- If the value of 1 minute in a certain period, or at a specific time point is much greater than that of 15 minutes, it means that the load in the last 1 minute is increasing, and you need to keep observing. Once the value of 1 minute exceeds the number of CPUs, it may mean that the system is overloaded. You need to further analyze the source of the problem.
- Conversely, if the value of 1 minute in a certain period, or at a specific time point is much less than that of 15 minutes, it means that the load of the system is decreasing in the last 1 minute, and a high load has been generated in the previous 15 minutes.
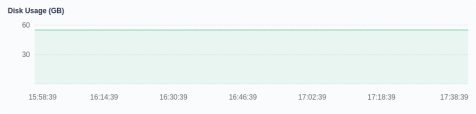
Disk usage
KubeSphere workloads such as StatefulSets and DaemonSets all rely on persistent volumes. Some components and services also require a persistent volume. Such backend storage relies on disks, such as block storage or network shared storage. In this connection, providing a real-time monitoring environment for disk usage is an important part of maintaining the high reliability of data.
In the daily management of the Linux system, platform administrators may encounter data loss or even system crashes due to insufficient disk space. As an essential part of cluster management, they need to pay close attention to the disk usage of the system and ensure that the file system is not filling up or abused. By monitoring the historical data of disk usage, you can evaluate how disks are used during a given period of time. In the case of high disk usage, you can free up disk space by cleaning up unnecessary images or containers.
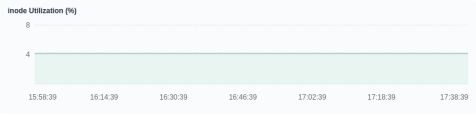
inode utilization
Each file must have an inode, which is used to store the file’s meta-information, such as the file’s creator and creation date. The inode will also consume hard disk space, and many small cache files can easily lead to the exhaustion of inode resources. Also, the inode may be used up, but the hard disk is not full. In this case, new files cannot be created on the hard disk.
In KubeSphere, the monitoring of inode utilization can help you detect such situations in advance, as you can have a clear view of cluster inode usage. The mechanism prompts users to clean up temporary files in time, preventing the cluster from being unable to work due to inode exhaustion.
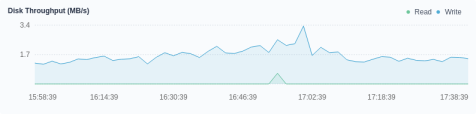
Disk throughput
The monitoring of disk throughput and IOPS is an indispensable part of disk monitoring, which is convenient for cluster administrators to adjust data layout and other management activities to optimize the overall performance of the cluster. Disk throughput refers to the speed of the disk transmission data stream (shown in MB/s), and the transmission data are the sum of data reading and writing. When large blocks of discontinuous data are being transmitted, this indicator is of great importance for reference.
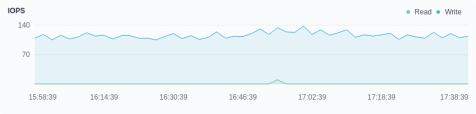
IOPS
IOPS (Input/Output Operations Per Second) represents a performance measurement of the number of read and write operations per second. Specifically, the IOPS of a disk is the sum of the number of continuous reads and writes per second. This indicator is of great significance for reference when small blocks of discontinuous data are being transmitted.
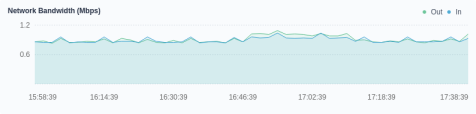
Network bandwidth
The network bandwidth is the ability of the network card to receive or send data per second, shown in Mbps (megabits per second).
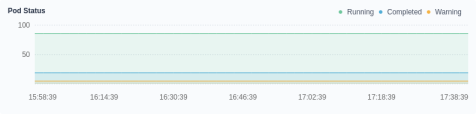
Pod status
Pod status displays the total number of pods in different states, including Running, Completed and Warning. The pod tagged Completed usually refers to a Job or a CronJob. The number of pods marked Warning, which means an abnormal state, requires special attention.
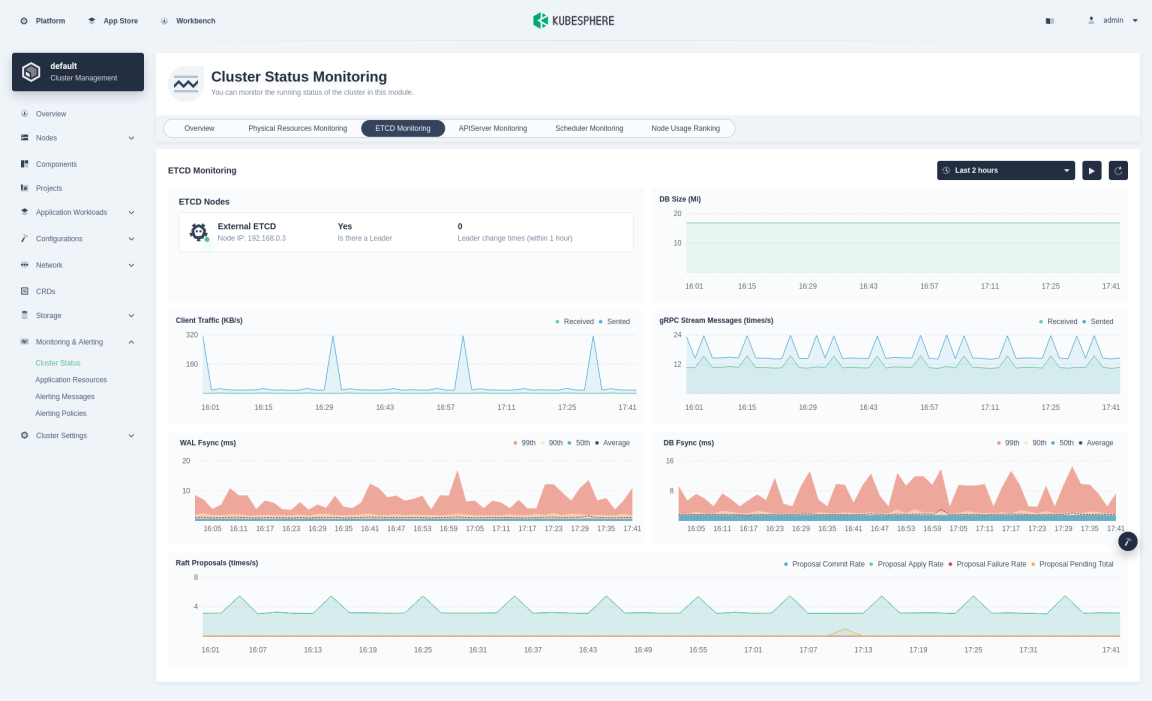
ETCD Monitoring
ETCD monitoring helps you to make better use of ETCD, especially to locate performance problems. The ETCD service provides metrics interfaces natively, and the KubeSphere monitoring system features a highly graphic and responsive dashboard to display its native data.
| Indicators | Description |
|---|---|
| ETCD Nodes | - Is there a Leader indicates whether the member has a Leader. If a member does not have a Leader, it is completely unavailable. If all members in the cluster do not have any Leader, the entire cluster is completely unavailable. - Leader change times refers to the number of Leader changes seen by members of the cluster since the beginning. Frequent Leader changes will significantly affect the performance of ETCD. It also shows that the Leader is unstable, possibly due to network connection issues or excessive loads hitting the ETCD cluster. |
| DB Size | The size of the underlying database (in MiB) of ETCD. The current graph shows the average size of each member database of ETCD. |
| Client Traffic | It includes the total traffic sent to the grpc client and the total traffic received from the grpc client. For more information about the indicator, see etcd Network. |
| gRPC Stream Messages | The gRPC streaming message receiving rate and sending rate on the server side, which reflects whether large-scale data read and write operations are happening in the cluster. For more information about the indicator, see go-grpc-prometheus. |
| WAL Fsync | The latency of WAL calling fsync. A wal_fsync is called when etcd persists its log entries to disk before applying them. For more information about the indicator, see etcd Disk. |
| DB Fsync | The submission delay distribution of the backend calls. When ETCD submits its most recent incremental snapshot to disk, a backend_commit will be called. Note that high latency of disk operations (long WAL log synchronization time or library synchronization time) usually indicates disk problems, which may cause high request latency or make the cluster unstable. For more information about the indicator, see etcd Disk. |
| Raft Proposals | - Proposal Commit Rate records the rate of consensus proposals committed. If the cluster is healthy, this indicator should increase over time. Several healthy members of an ETCD cluster may have different general proposals at the same time. A continuous large lag between a single member and its leader indicates that the member is slow or unhealthy. - Proposal Apply Rate records the total rate of consensus proposals applied. The ETCD server applies each committed proposal asynchronously. The difference between the Proposal Commit Rate and the Proposal Apply Rate should usually be small (only a few thousands even under high loads). If the difference between them continues to rise, it indicates that the ETCD server is overloaded. This can happen when using large-scale queries such as heavy range queries or large txn operations. - Proposal Failure Rate records the total rate of failed proposals, usually related to two issues: temporary failures related to leader election or longer downtime due to a loss of quorum in the cluster. - Proposal Pending Total records the current number of pending proposals. An increase in pending proposals indicates high client loads or members unable to submit proposals. Currently, the data displayed on the dashboard is the average size of ETCD members. For more information about these indicators, see etcd Server. |
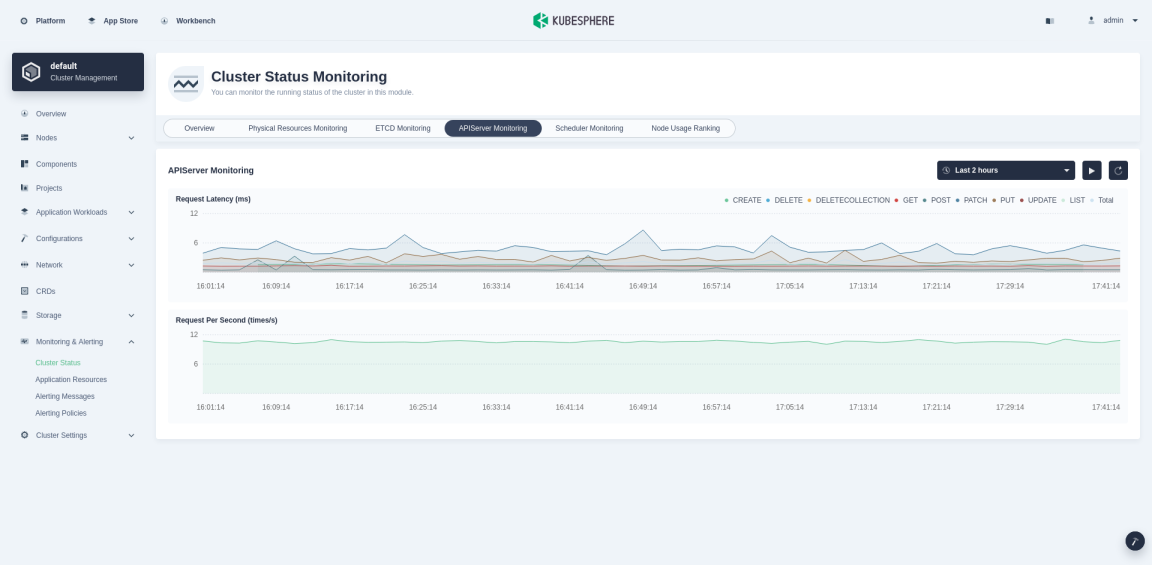
APIServer Monitoring
API Server is the hub for the interaction of all components in a Kubernetes cluster. The following table lists the main indicators monitored for the APIServer.
| Indicators | Description |
|---|---|
| Request Latency | Classified by HTTP request methods, the latency of resource request response in milliseconds. |
| Request Per Second | The number of requests accepted by kube-apiserver per second. |
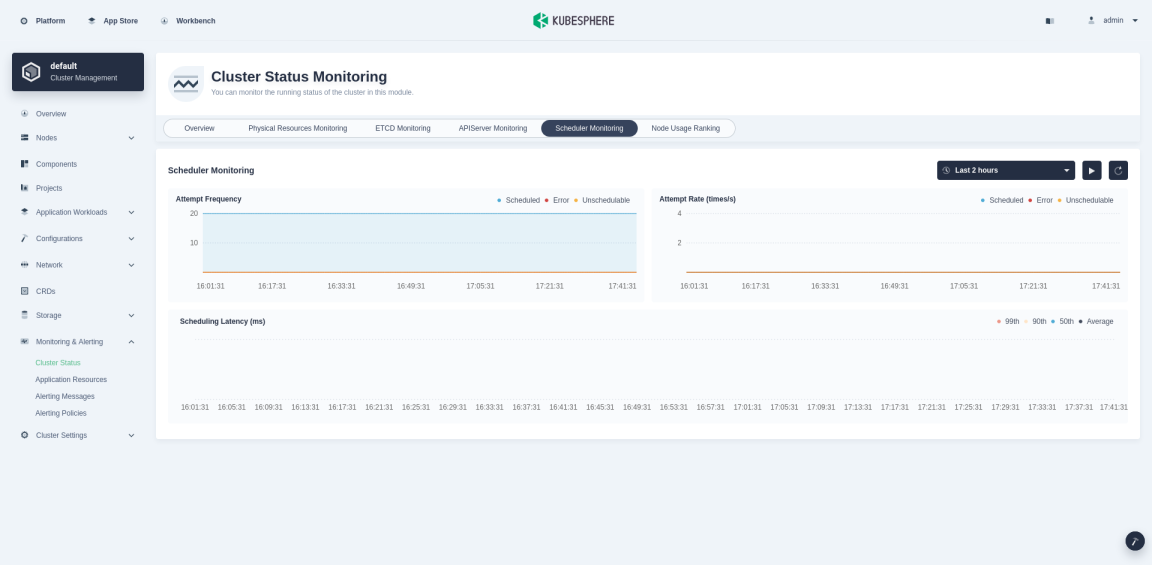
Scheduler Monitoring
Scheduler monitors the Kubernetes API of newly created pods and determines which nodes these new pods run on. It makes this decision based on available data, including the availability of collected resources and the resource requirements of the Pod. Monitoring data for scheduling delays ensures that you can see any delays facing the scheduler.
| Indicators | Description |
|---|---|
| Attempt Frequency | Include the number of scheduling successes, errors, and failures. |
| Attempt Rate | Include the scheduling rate of successes, errors, and failures. |
| Scheduling latency | End-to-end scheduling delay, which is the sum of scheduling algorithm delay and binding delay |
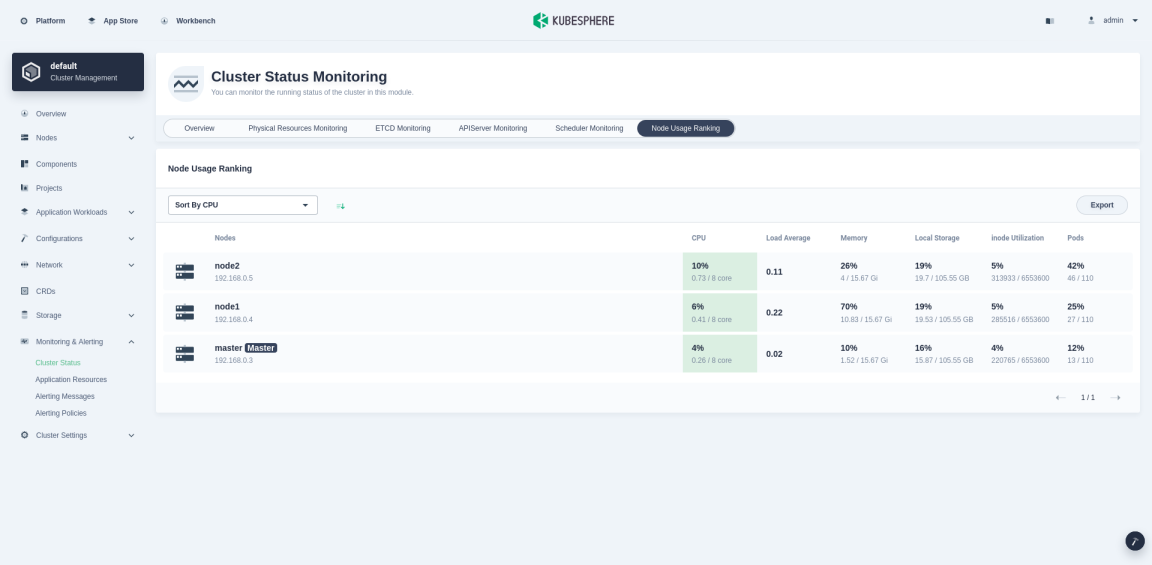
Node Usage Ranking
You can sort nodes in ascending and descending order by indicators such as CPU, Load Average, Memory, Local Storage, inode Utilization, and Pod Utilization. This enables administrators to quickly find potential problems or identify a node’s insufficient resources.
 Previous

What’s on this Page