


You are viewing documentation for KubeSphere version:v3.0.0
KubeSphere v3.0.0 documentation is no longer actively maintained. The version you are currently viewing is a static snapshot. For up-to-date documentation, see the latest version.


Add Fluentd as a Receiver (i.e. Collector)
You can use Elasticsearch, Kafka and Fluentd as log receivers in KubeSphere. This tutorial demonstrates:
- How to deploy Fluentd as a Deployment and create the corresponding Service and ConfigMap.
- How to add Fluentd as a log receiver to receive logs sent from Fluent Bit and then output to stdout.
- How to verify if Fluentd receives logs successfully.
Prerequisites
-
You need an account granted a role including the authorization of Clusters Management. For example, you can log in to the console as
admindirectly or create a new role with the authorization and assign it to an account. -
Before adding a log receiver, you need to enable any of the
logging,eventsorauditingcomponents. For more information, see Enable Pluggable Components.loggingis enabled as an example in this tutorial.
Step 1: Deploy Fluentd as a Deployment
Usually, Fluentd is deployed as a DaemonSet in Kubernetes to collect container logs on each node. KubeSphere chooses Fluent Bit because of its low memory footprint. Besides, Fluentd features numerous output plugins. Hence, KubeSphere chooses to deploy Fluentd as a Deployment to forward logs it receives from Fluent Bit to more destinations such as S3, MongoDB, Cassandra, MySQL, syslog and Splunk.
Run the following commands:
Note
- The following commands create the Fluentd Deployment, Service and ConfigMap in the
defaultnamespace and add a filter to the Fluentd ConfigMap to exclude logs from thedefaultnamespace to avoid Fluent Bit and Fluentd loop log collections. - Change the namespace if you want to deploy Fluentd into a different namespace.
cat <<EOF | kubectl apply -f -
apiVersion: v1
kind: ConfigMap
metadata:
  name: fluentd-config
  namespace: default
data:
  fluent.conf: |-
    # Receive logs sent from Fluent Bit on port 24224
    <source>
      @type forward
      port 24224
    </source>

    # Because this will send logs Fluentd received to stdout,
    # to avoid Fluent Bit and Fluentd loop logs collection,
    # add a filter here to avoid sending logs from the default namespace to stdout again
    <filter **>
      @type grep
      <exclude>
        key $.kubernetes.namespace_name
        pattern /^default$/
      </exclude>
    </filter>

    # Send received logs to stdout for demo/test purpose only
    # Various output plugins are supported to output logs to S3, MongoDB, Cassandra, MySQL, syslog, Splunk, etc.
    <match **>
      @type stdout
    </match>
---
apiVersion: apps/v1
kind: Deployment
metadata:
  labels:
    app: fluentd
  name: fluentd
  namespace: default
spec:
  replicas: 1
  selector:
    matchLabels:
      app: fluentd
  template:
    metadata:
      labels:
        app: fluentd
    spec:
      containers:
      - image: fluentd:v1.9.1-1.0
        imagePullPolicy: IfNotPresent
        name: fluentd
        ports:
        - containerPort: 24224
          name: forward
          protocol: TCP
        - containerPort: 5140
          name: syslog
          protocol: TCP
        volumeMounts:
        - mountPath: /fluentd/etc
          name: config
          readOnly: true
      volumes:
      - configMap:
          defaultMode: 420
          name: fluentd-config
        name: config
---
apiVersion: v1
kind: Service
metadata:
  labels:
    app: fluentd-svc
  name: fluentd-svc
  namespace: default
spec:
  ports:
  - name: forward
    port: 24224
    protocol: TCP
    targetPort: forward
  selector:
    app: fluentd
  sessionAffinity: None
  type: ClusterIP
EOF
Step 2: Add Fluentd as a Log Receiver (i.e. Collector)
-
Log in to KubeSphere as
admin. Click Platform in the top left corner and select Clusters Management. -
If you have enabled the multi-cluster feature, you can select a specific cluster. If you have not enabled the feature, refer to the next step directly.
-
On the Cluster Management page, go to Log Collections in Cluster Settings.
-
Click Add Log Collector and choose Fluentd.
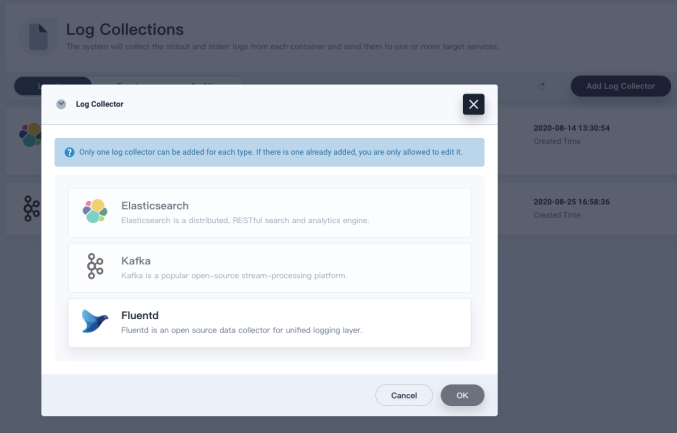
-
Provide the Fluentd service address and port as below:
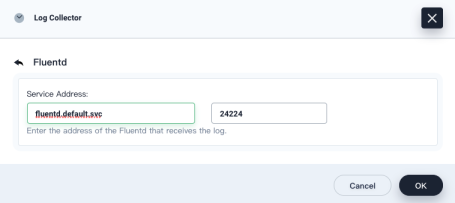
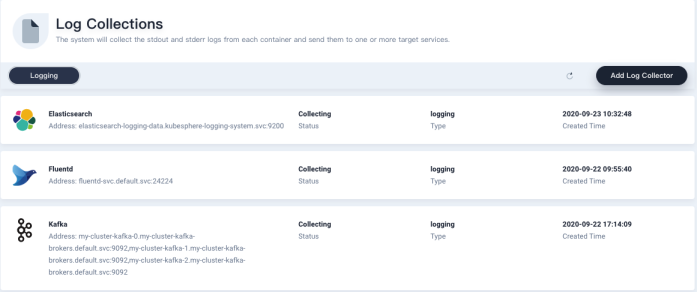
-
Fluentd will appear in the receiver list on the Log Collections page, the status of which is Collecting.
Step 3: Verify Fluentd is Receiving Logs Sent from Fluent Bit
-
Click Application Workloads on the Cluster Management page.
-
Select Workloads and then select the
defaultproject from the drop-down list in the Deployments tab. -
Click the fluentd item and then select the fluentd-xxxxxxxxx-xxxxx Pod.
-
Click the fluentd container.
-
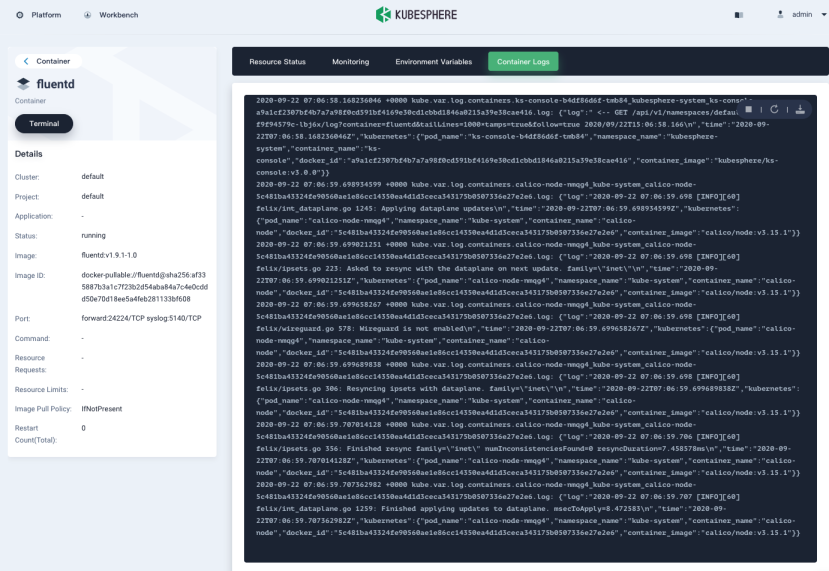
On the fluentd container page, select the Container Logs tab.
-
You can see logs begin to scroll up continuously.
 Previous

What’s on this Page