


You are viewing documentation for KubeSphere version:v3.0.0
KubeSphere v3.0.0 documentation is no longer actively maintained. The version you are currently viewing is a static snapshot. For up-to-date documentation, see the latest version.


Add Elasticsearch as a Receiver (i.e. Collector)
You can use Elasticsearch, Kafka and Fluentd as log receivers in KubeSphere. This tutorial demonstrates how to add an Elasticsearch receiver.
Prerequisites
-
You need an account granted a role including the authorization of Clusters Management. For example, you can log in to the console as
admindirectly or create a new role with the authorization and assign it to an account. -
Before adding a log receiver, you need to enable any of the
logging,eventsorauditingcomponents. For more information, see Enable Pluggable Components.loggingis enabled as an example in this tutorial.
Add Elasticsearch as a Receiver
-
Log in to KubeSphere as
admin. Click Platform in the top left corner and select Clusters Management. -
If you have enabled the multi-cluster feature, you can select a specific cluster. If you have not enabled the feature, refer to the next step directly.
-
On the Cluster Management page, go to Log Collections in Cluster Settings.
-
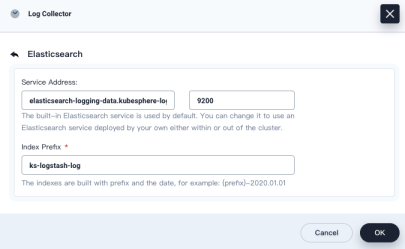
Click Add Log Collector and choose Elasticsearch.

-
Provide the Elasticsearch service address and port as below:
-
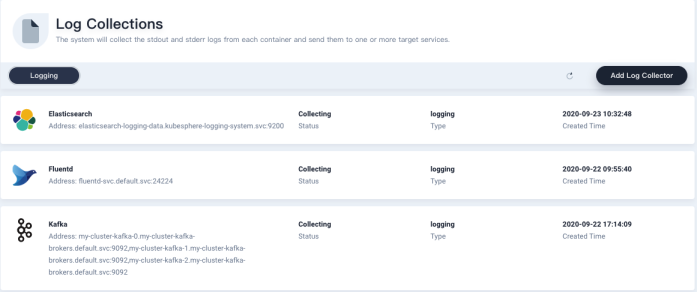
Elasticsearch will appear in the receiver list on the Log Collections page, the status of which is Collecting.
-
To verify whether Elasticsearch is receiving logs sent from Fluent Bit, click Log Search in the Toolbox in the bottom right corner and search logs on the console. For more information, read Log Query.
 Previous

What’s on this Page