


You are viewing documentation for KubeSphere version:v3.0.0
KubeSphere v3.0.0 documentation is no longer actively maintained. The version you are currently viewing is a static snapshot. For up-to-date documentation, see the latest version.


Application Resources Monitoring
In addition to monitoring data at the physical resource level, cluster administrators also need to keep a close track of application resources across the platform, such as the number of projects and DevOps projects, as well as the number of workloads and services of a specific type. Application resource monitoring provides a summary of resource usage and application-level trends of the platform.
Prerequisites
You need an account granted a role including the authorization of Clusters Management. For example, you can log in to the console as admin directly or create a new role with the authorization and assign it to an account.
Resource Usage
-
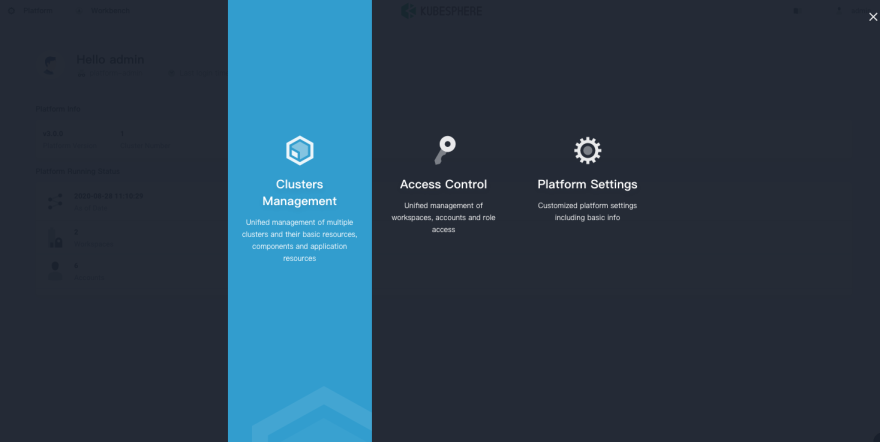
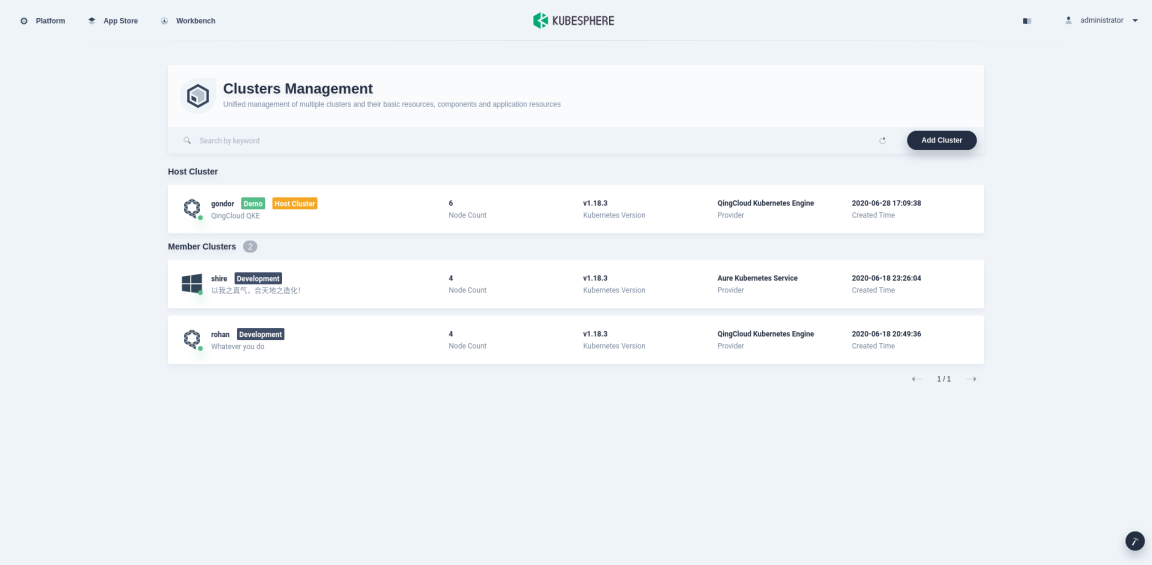
Click Platform in the top left corner and select Clusters Management.
-
If you have enabled the multi-cluster feature with member clusters imported, you can select a specific cluster to view its application resources. If you have not enabled the feature, refer to the next step directly.
-
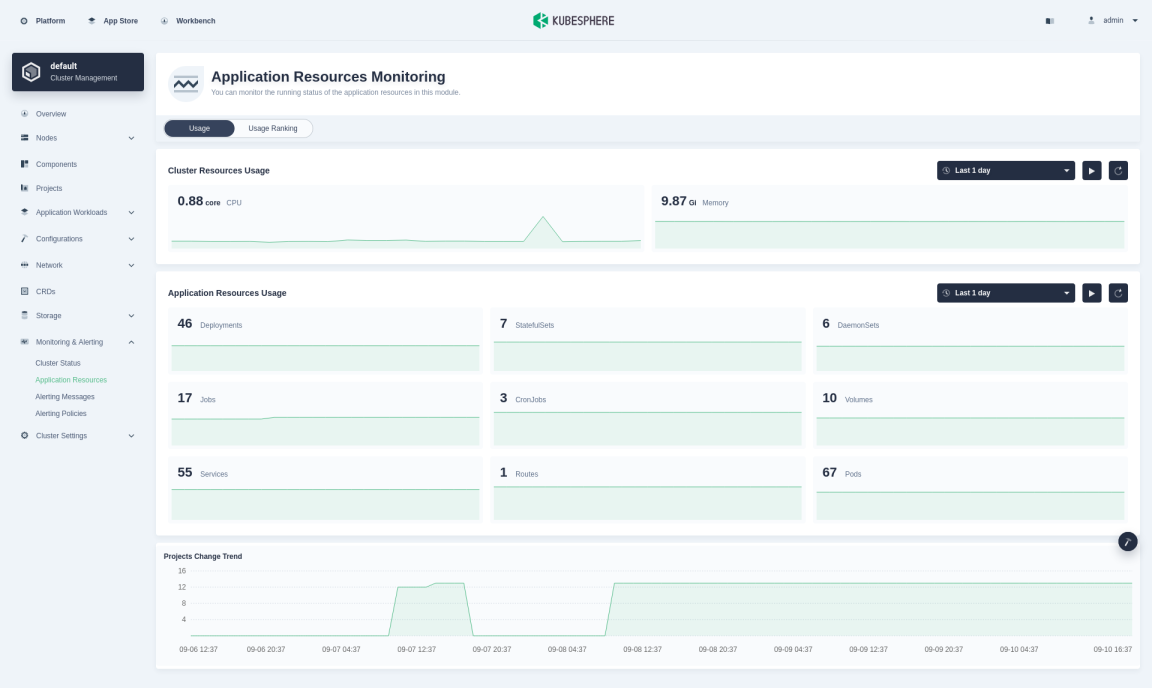
Choose Application Resources under Monitoring & Alerting to see the overview of application resource monitoring, including the summary of the usage of all resources in the cluster, as shown in the following figure.
-
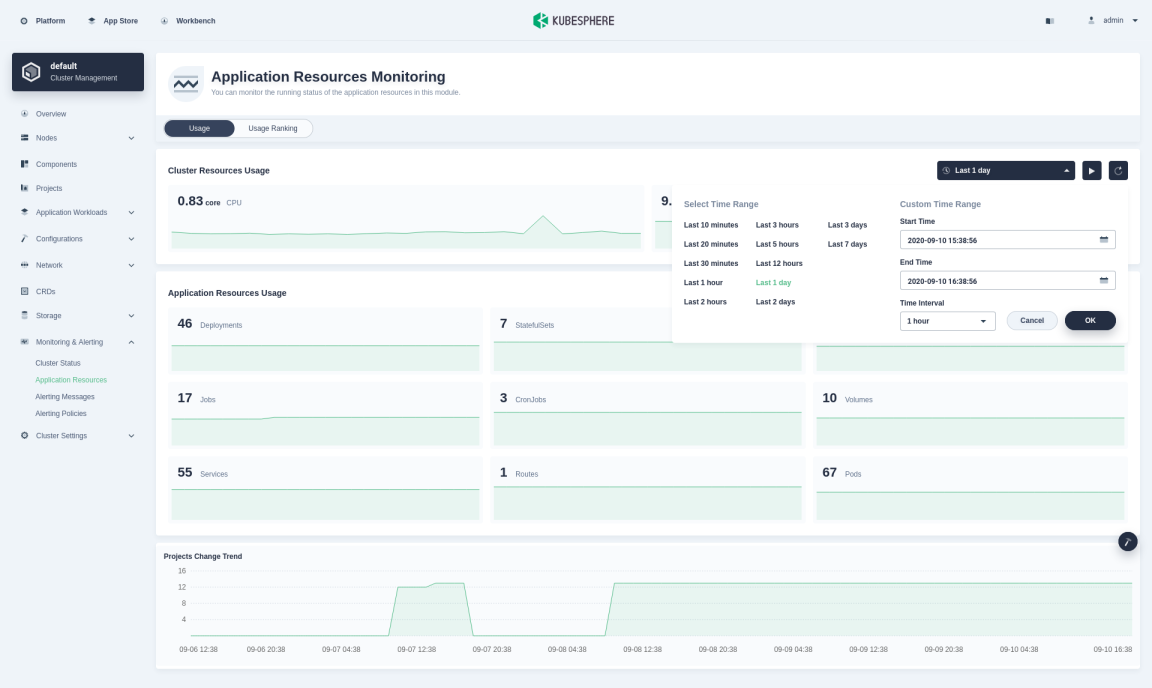
Among them, Cluster Resources Usage and Application Resources Usage retain the monitoring data of the last 7 days and support custom time range queries.
-
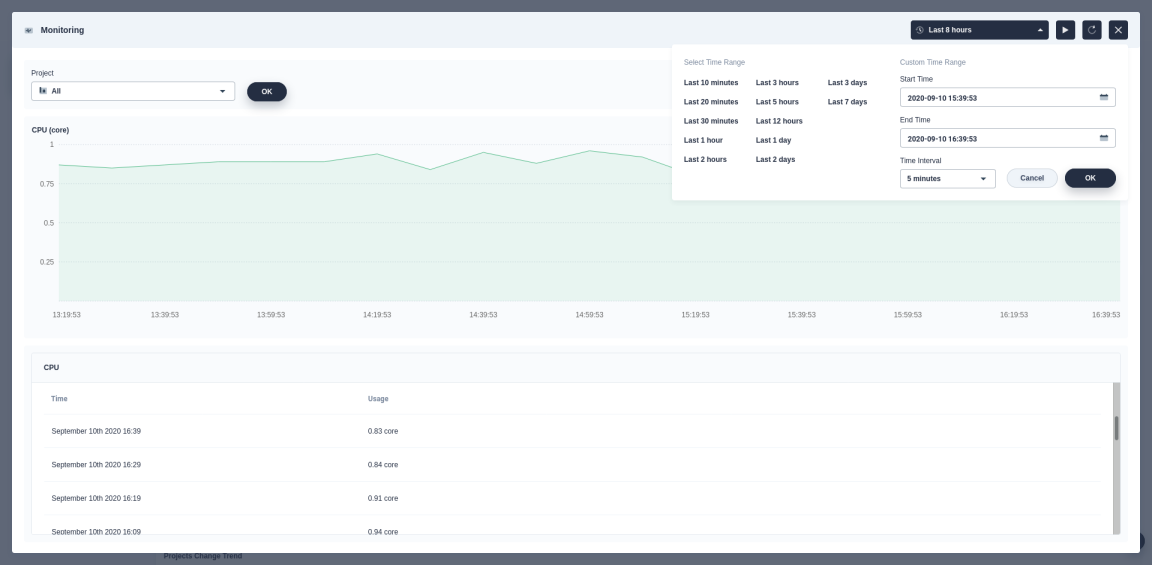
Click a specific resource to view detailed usage and trends of it during a certain time period, such as CPU under Cluster Resources Usage. The detail page allows you to view specific monitoring data by project. The highly-interactive dashboard enables users to customize the time range, displaying the exact resource usage at a given time point.
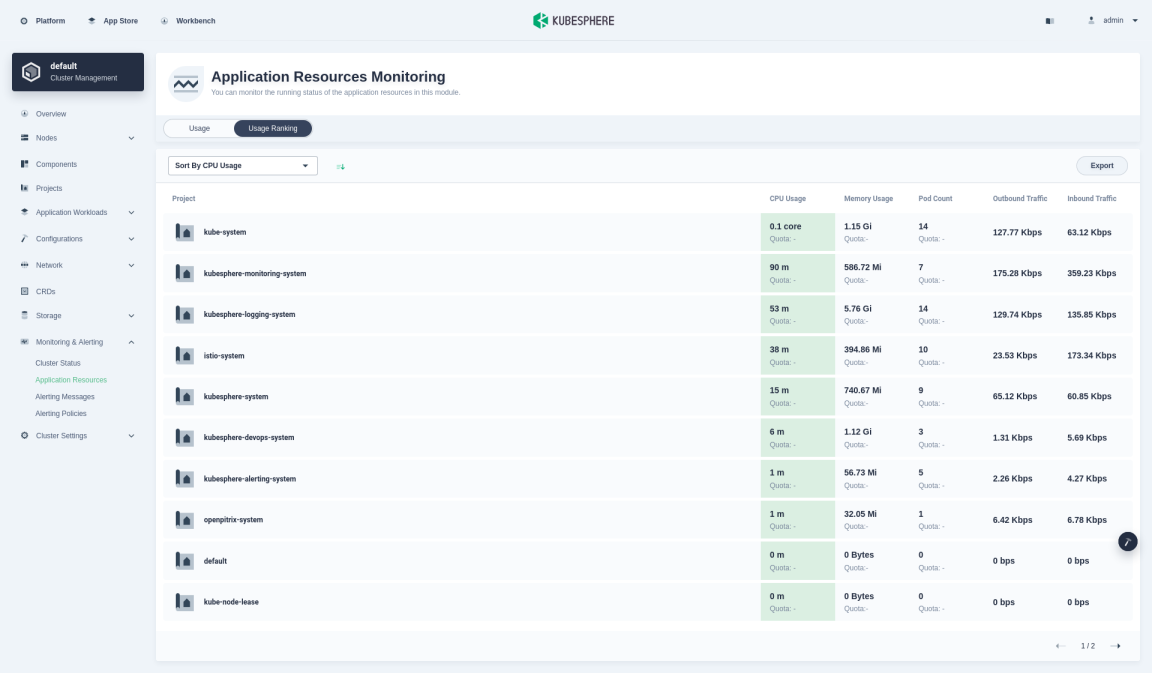
Usage Ranking
Usage Ranking supports the sorting of project resource usage, so that platform administrators can understand the resource usage of each project in the current cluster, including CPU Usage, Memory Usage, Pod Count, as well as Outbound Traffic and Inbound Traffic. You can sort projects in ascending or descending order by one of the indicators in the drop-down list. This feature is very useful for quickly locating your application (Pod) that is consuming heavy CPU or memory.
 Previous

What’s on this Page