
You are viewing documentation for KubeSphere version:v3.0.0
KubeSphere v3.0.0 documentation is no longer actively maintained. The version you are currently viewing is a static snapshot. For up-to-date documentation, see the latest version.
Deploy TiDB Operator and a TiDB Cluster on KubeSphere
TiDB is a cloud-native, open-source NewSQL database that supports Hybrid Transactional and Analytical Processing (HTAP) workloads. It features horizontal scalability, strong consistency, and high availability.
This tutorial demonstrates how to deploy TiDB Operator and a TiDB Cluster on KubeSphere.
Prerequisites
- You need to have at least 3 schedulable nodes.
- You need to enable the OpenPitrix system.
- You need to create a workspace, a project, and two user accounts (
ws-adminandproject-regular) for this tutorial. The accountws-adminmust be granted the role ofworkspace-adminin the workspace, and the accountproject-regularmust be invited to the project with the role ofoperator. If they are not ready, refer to Create Workspaces, Projects, Accounts and Roles.
Hands-on Lab
Step 1: Install TiDB Operator CRD
-
Log in to the KubeSphere Web console as
admin, and use Kubectl from the Toolbox in the bottom right corner to execute the following command to install TiDB Operator CRD:kubectl apply -f https://raw.githubusercontent.com/pingcap/tidb-operator/v1.1.6/manifests/crd.yaml -
You can see the expected output as below:
customresourcedefinition.apiextensions.k8s.io/tidbclusters.pingcap.com created
customresourcedefinition.apiextensions.k8s.io/backups.pingcap.com created
customresourcedefinition.apiextensions.k8s.io/restores.pingcap.com created
customresourcedefinition.apiextensions.k8s.io/backupschedules.pingcap.com created
customresourcedefinition.apiextensions.k8s.io/tidbmonitors.pingcap.com created
customresourcedefinition.apiextensions.k8s.io/tidbinitializers.pingcap.com created
customresourcedefinition.apiextensions.k8s.io/tidbclusterautoscalers.pingcap.com created
Step 2: Add an app repository
-
Log out of KubeSphere and log back in as
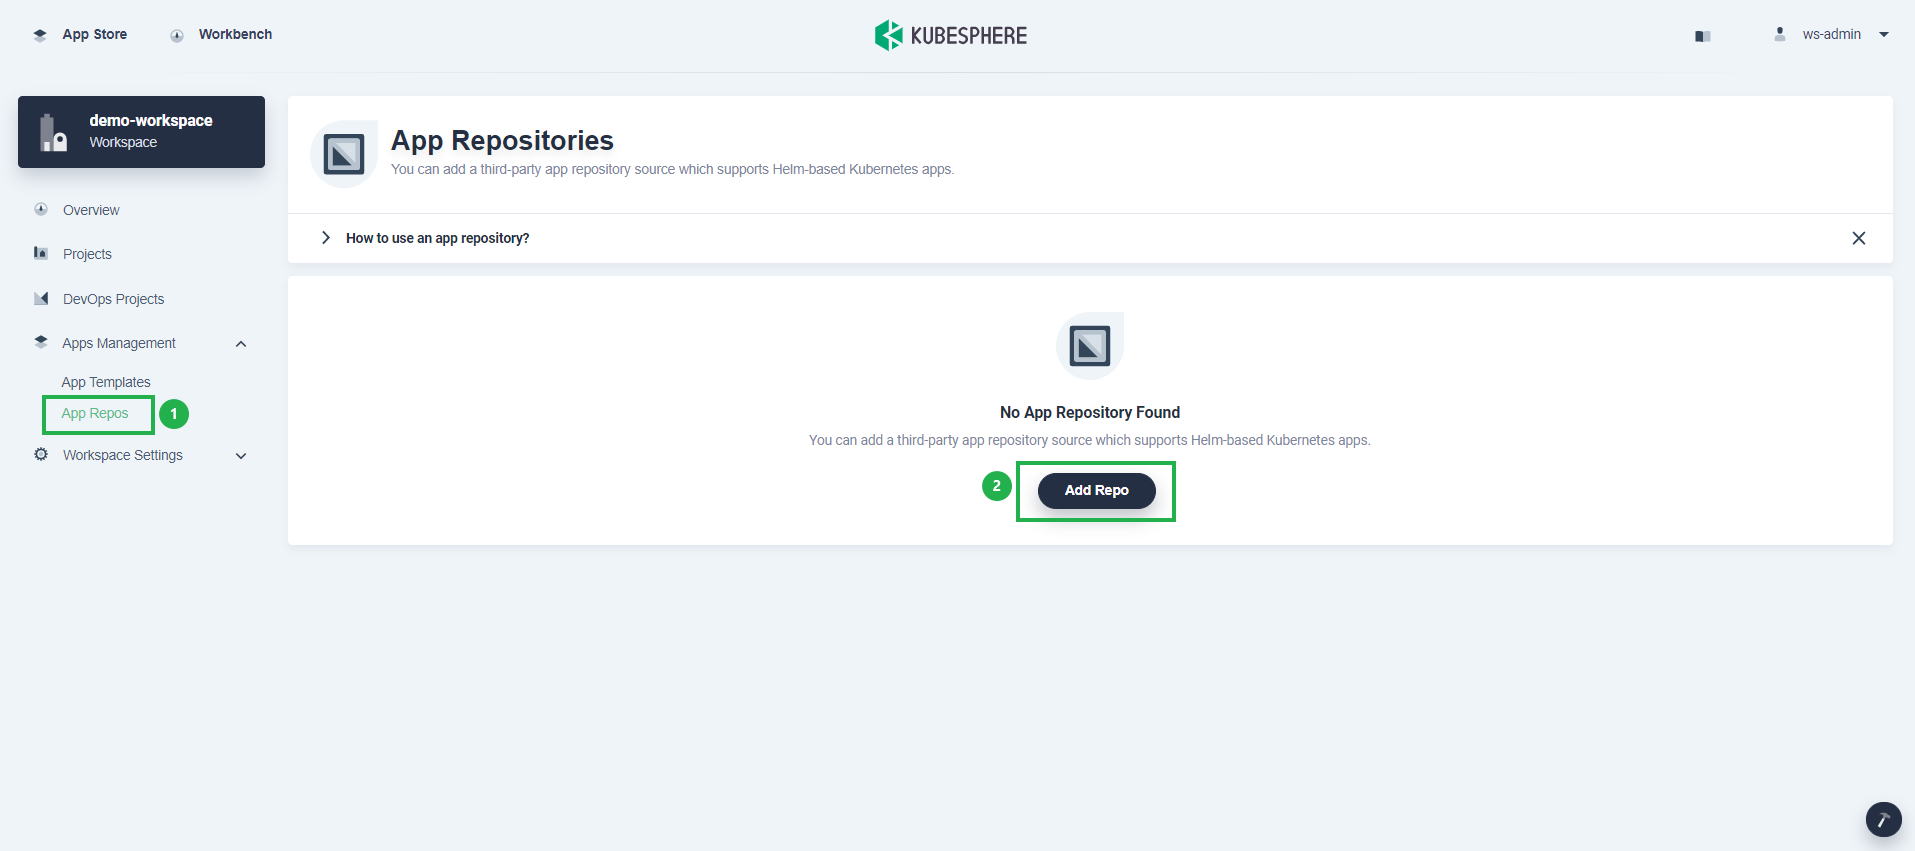
ws-admin. In your workspace, go to App Repos under Apps Management, and then click Add Repo. -
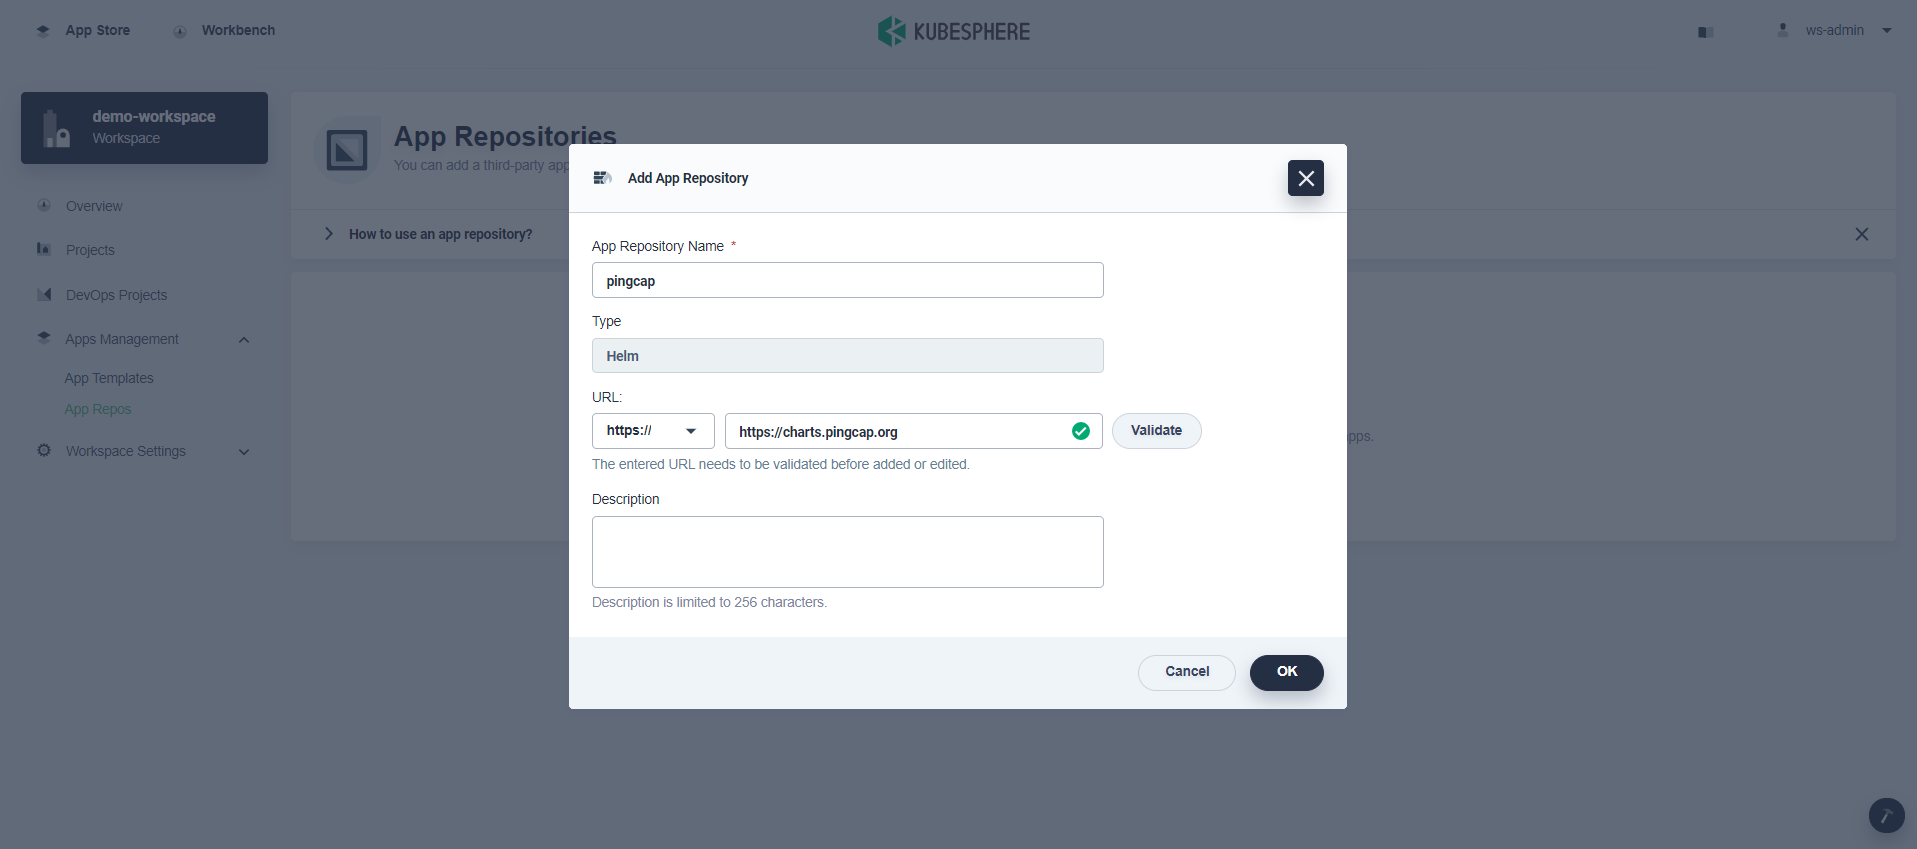
In the dialog that appears, enter
pingcapfor the app repository name andhttps://charts.pingcap.orgfor the PingCAP Helm repository URL. Click Validate to verify the URL and you will see a green check mark next to the URL if it is available. Click OK to continue. -
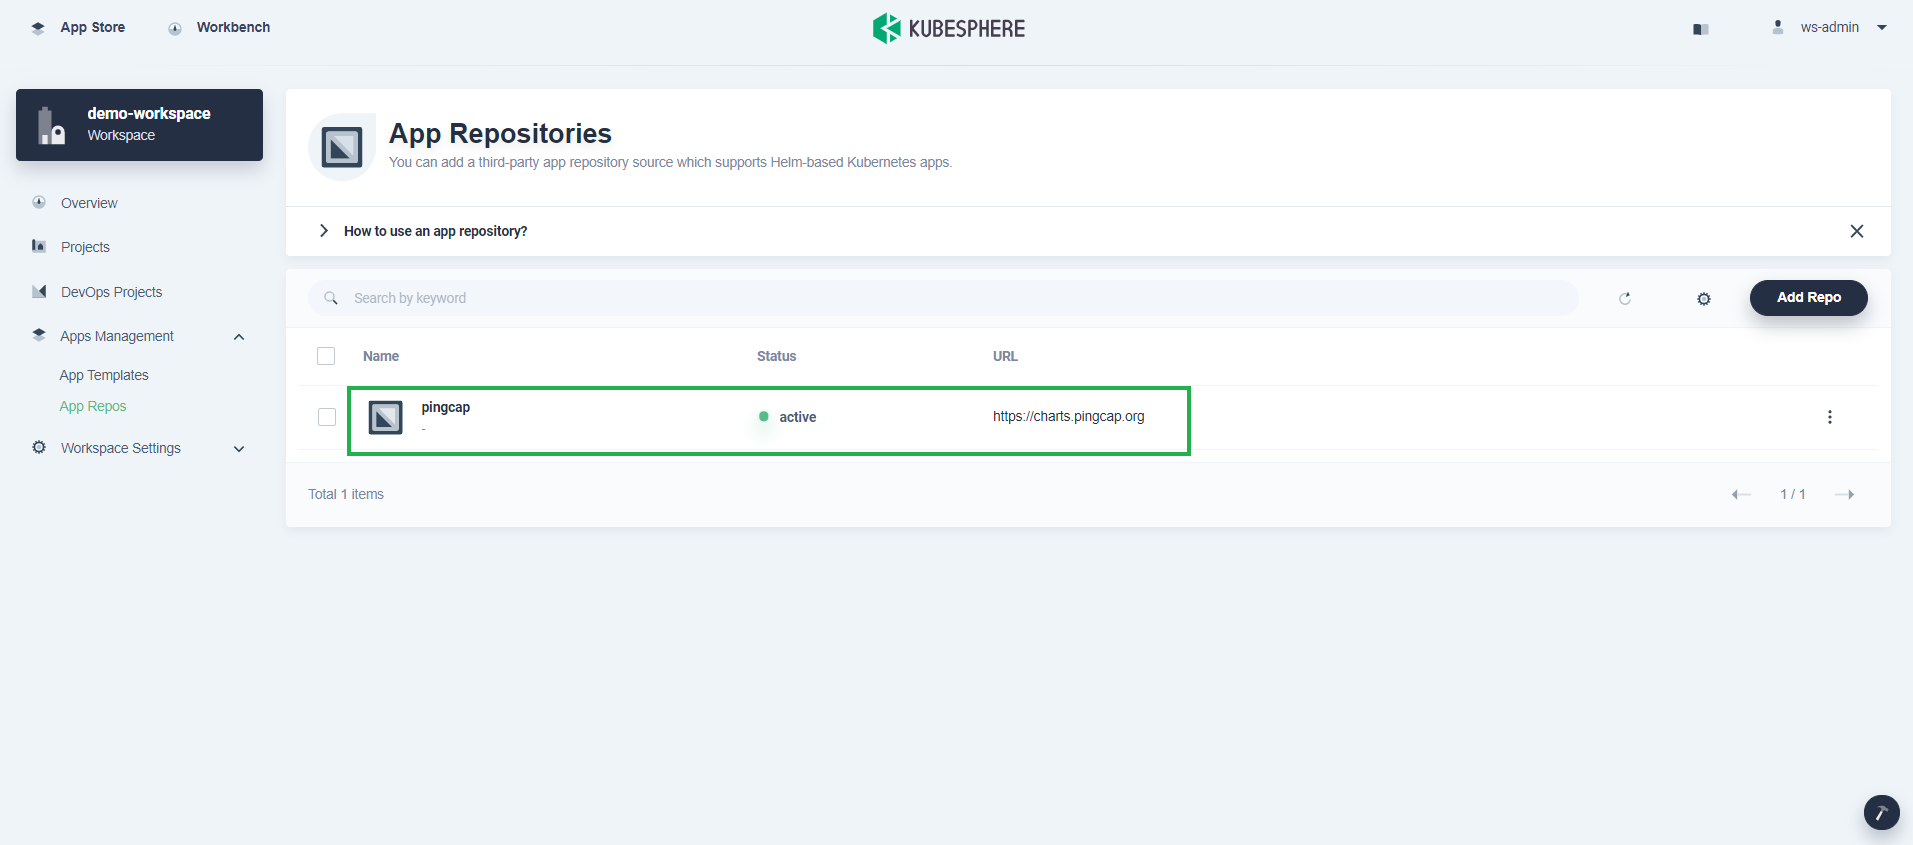
Your repository displays in the list after successfully imported to KubeSphere.
Step 3: Deploy TiDB Operator
-
Log out of KubeSphere and log back in as
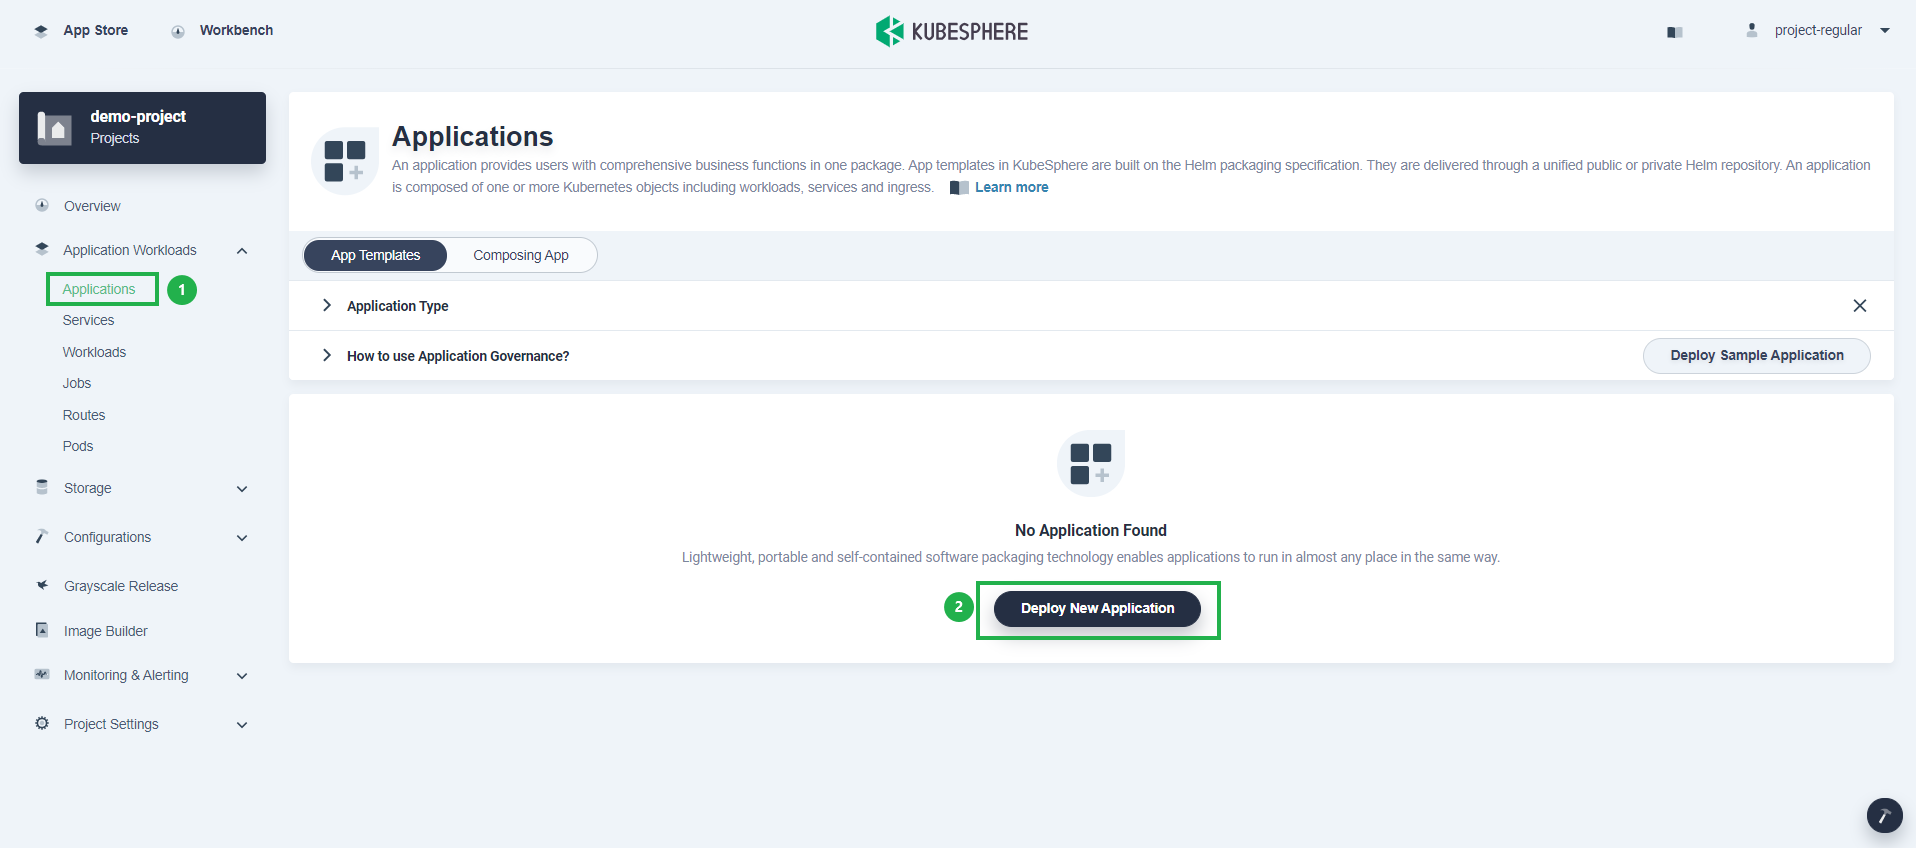
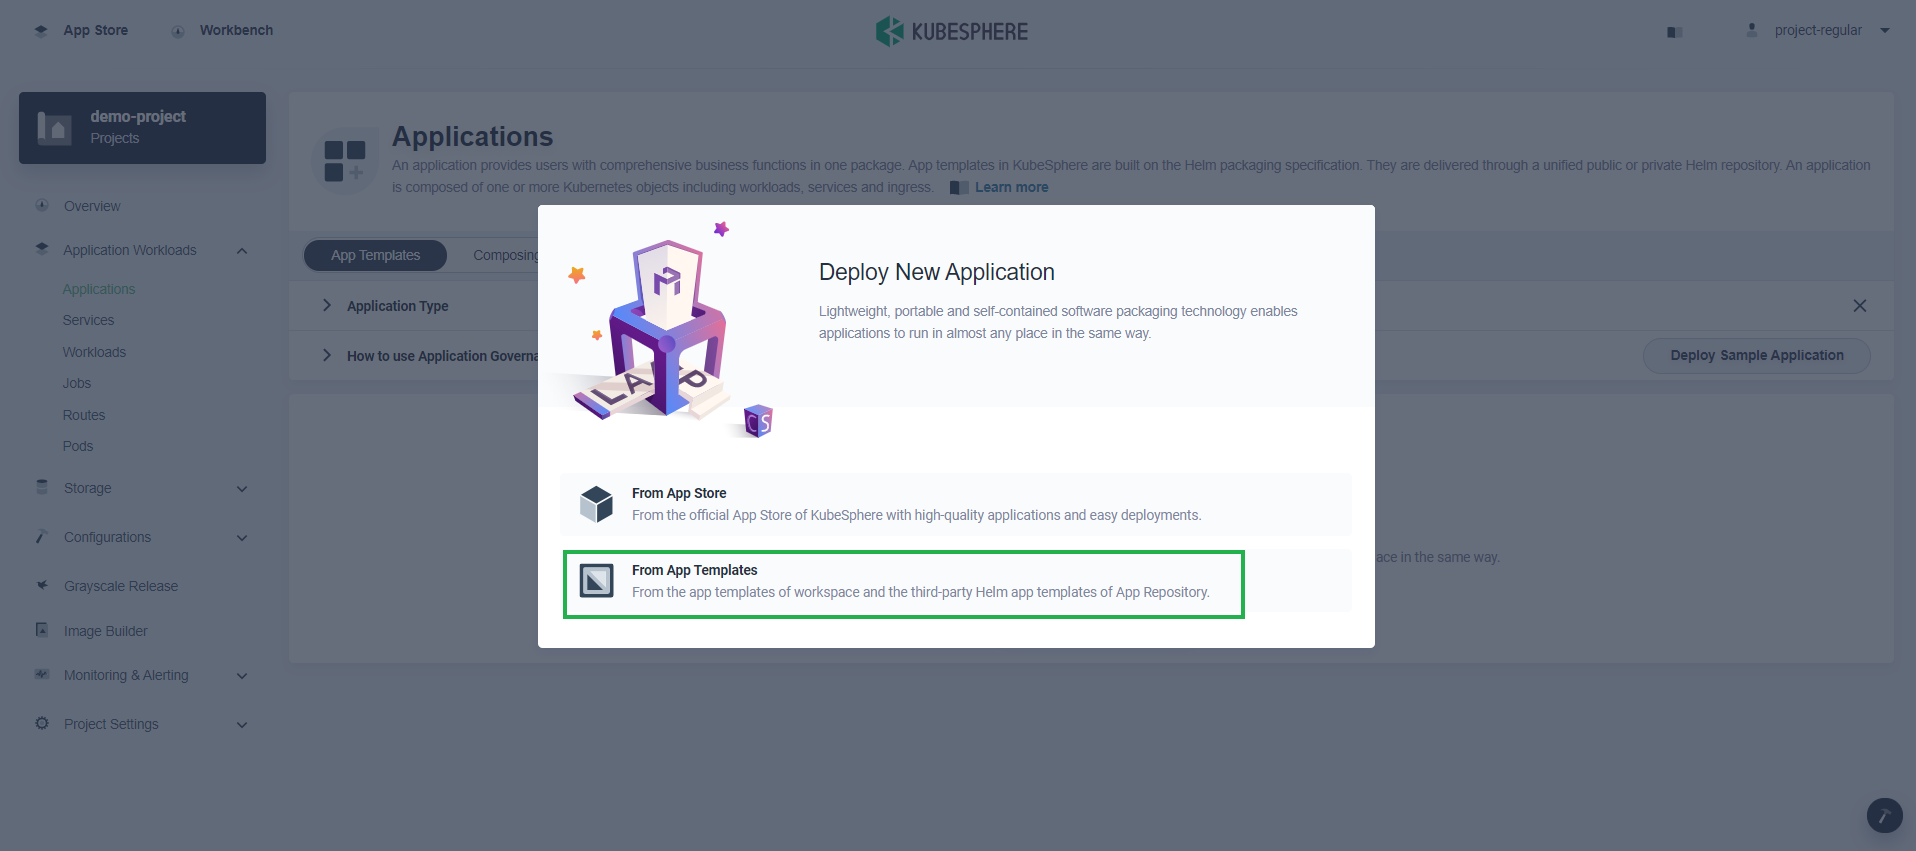
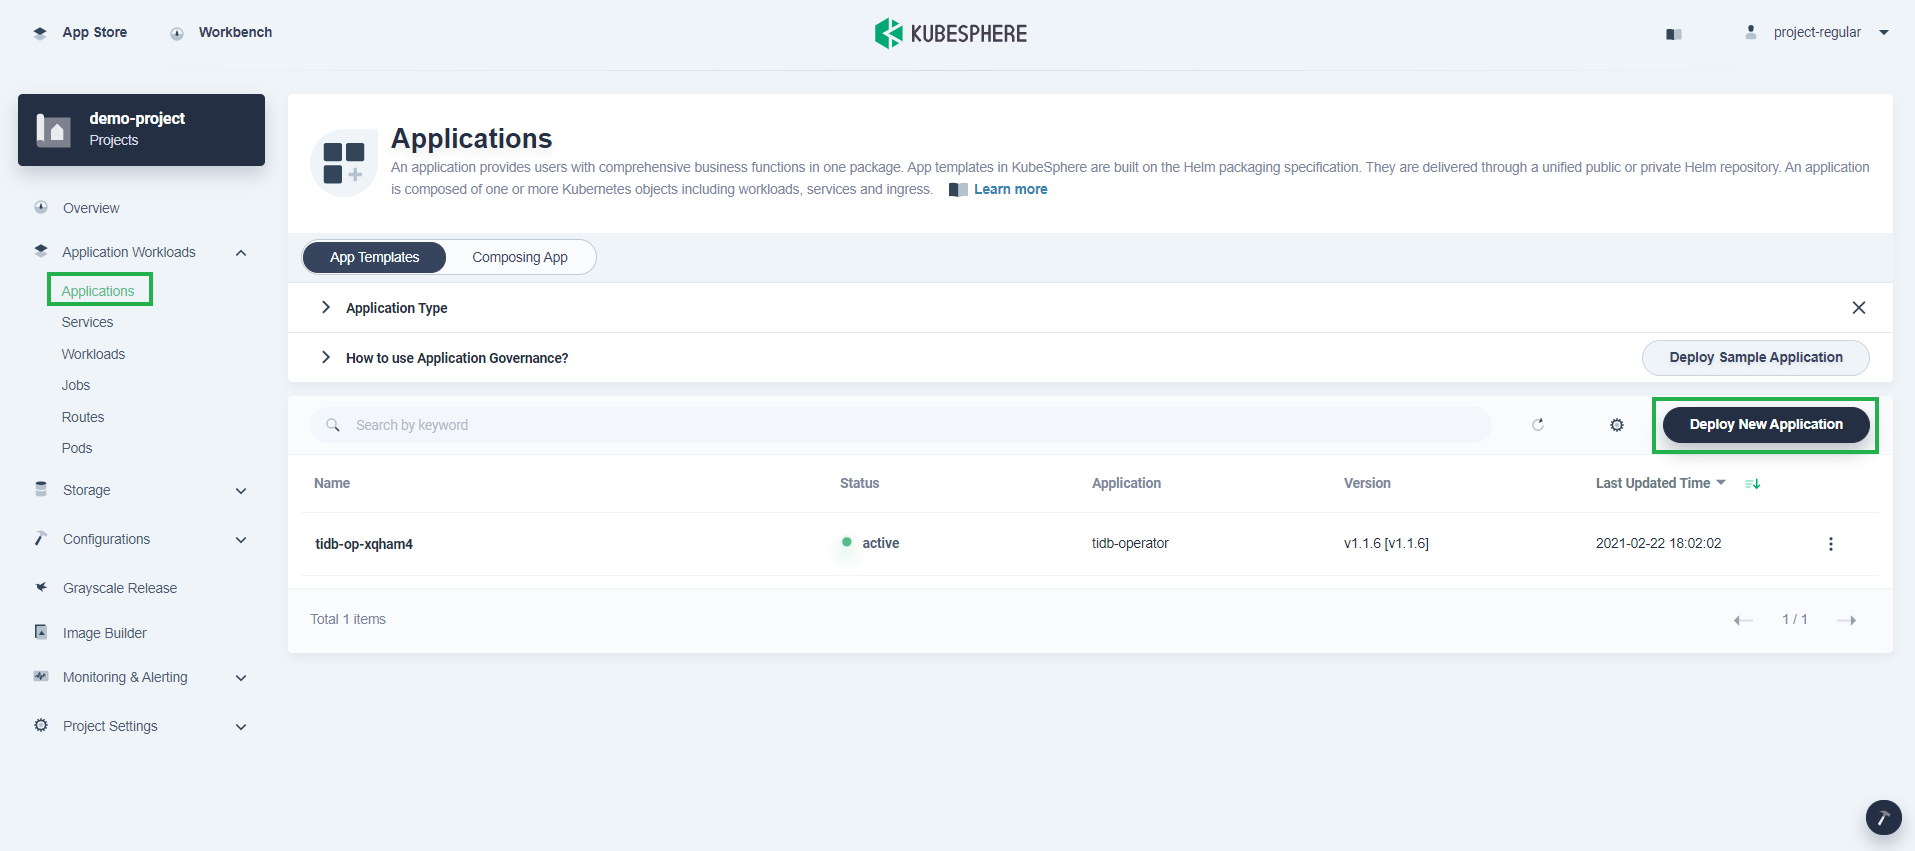
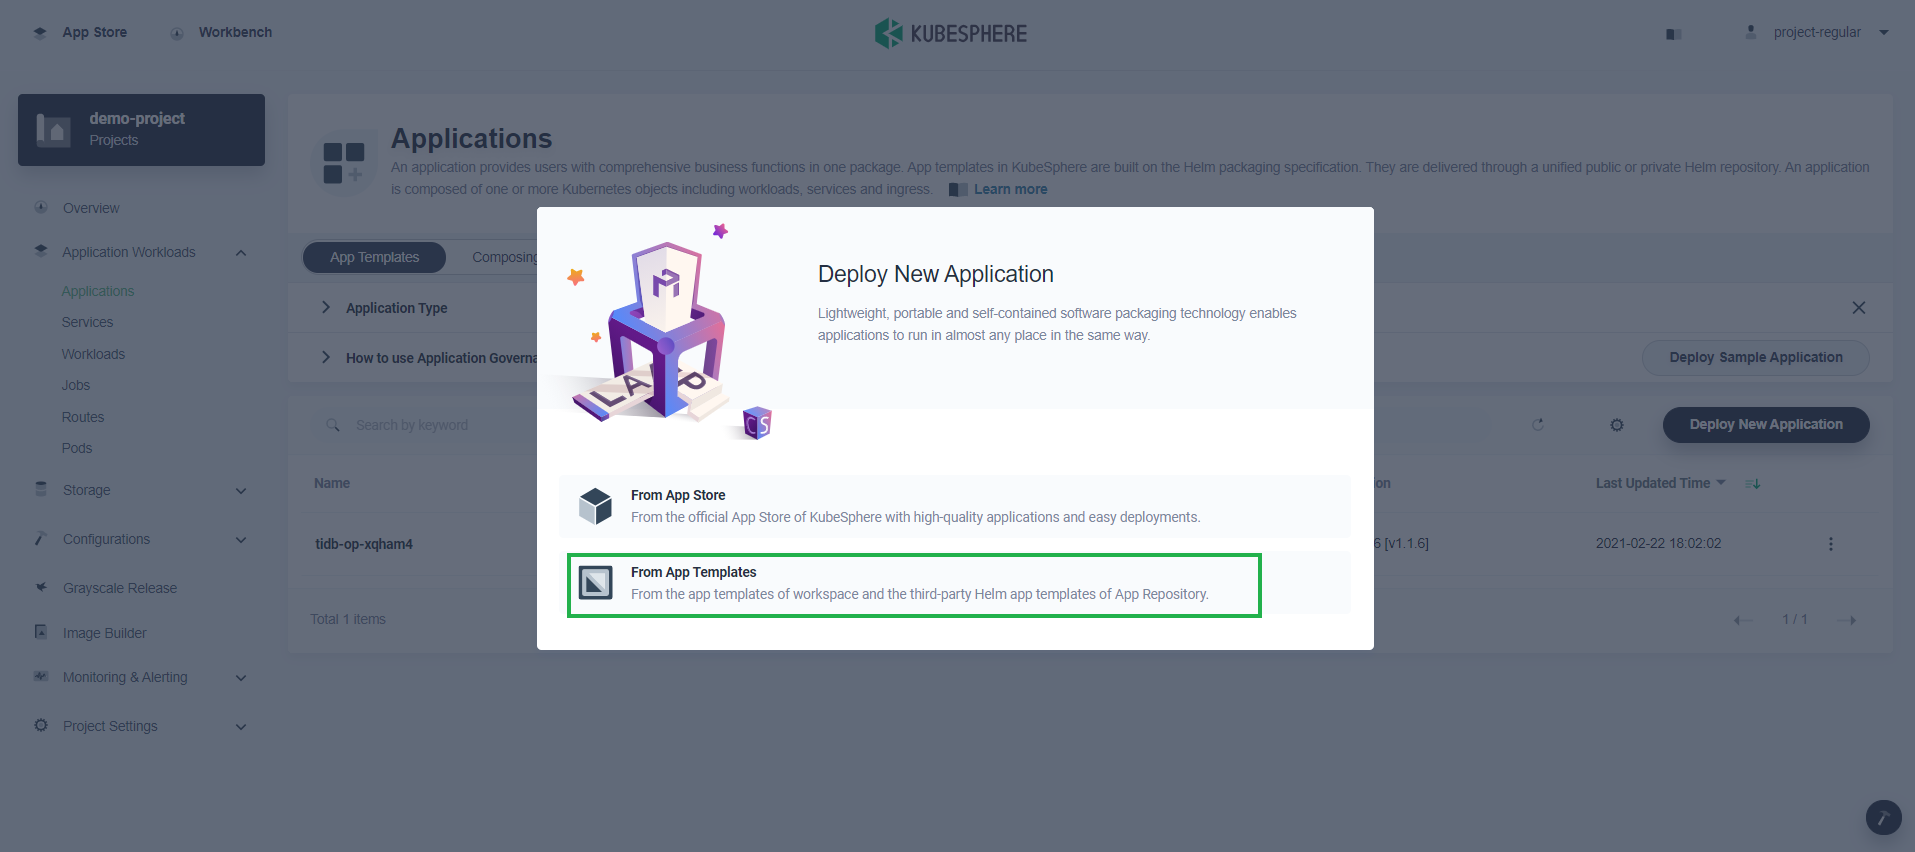
project-regular. In your project, go to Applications under Application Workloads and click Deploy New Application. -
In the dialog that appears, select From App Templates.
-
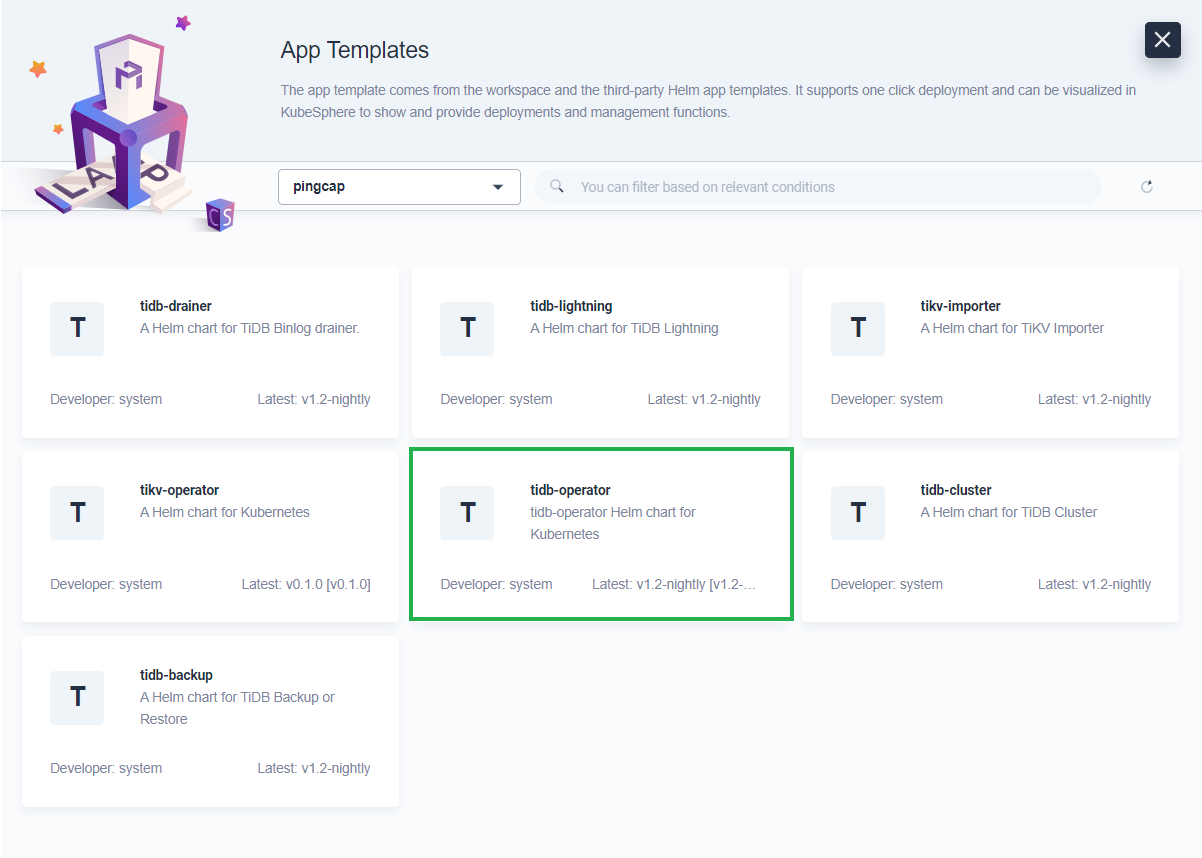
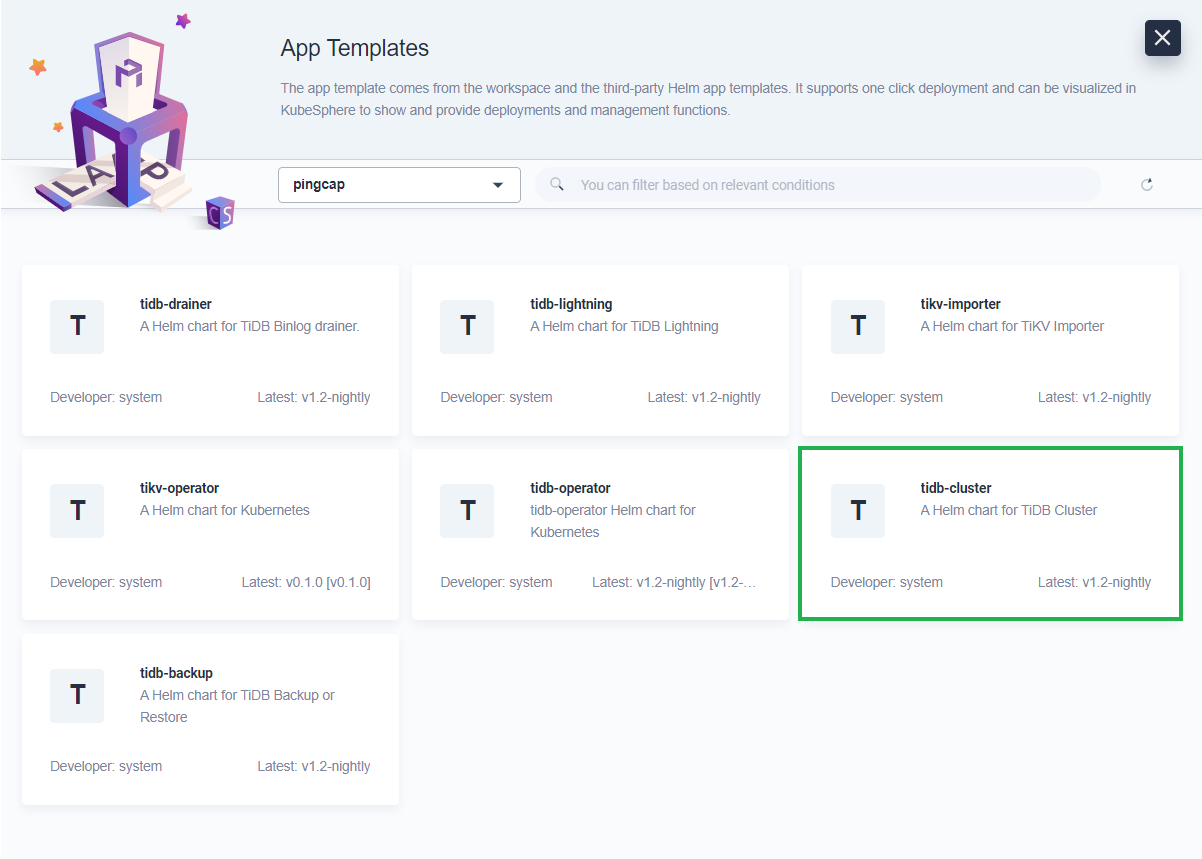
Select
pingcapfrom the drop-down list, then click tidb-operator.Note
This tutorial only demonstrates how to deploy TiDB Operator and a TiDB cluster. You can also deploy other tools based on your needs. -
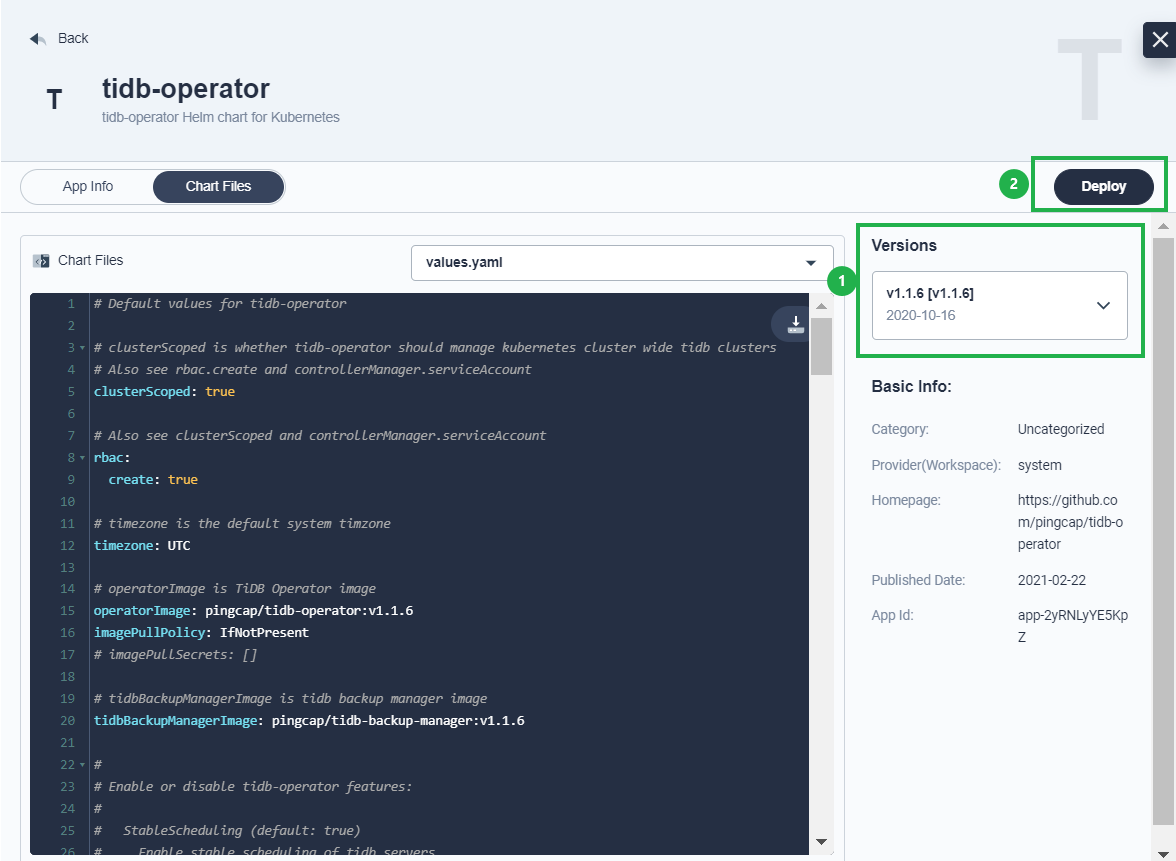
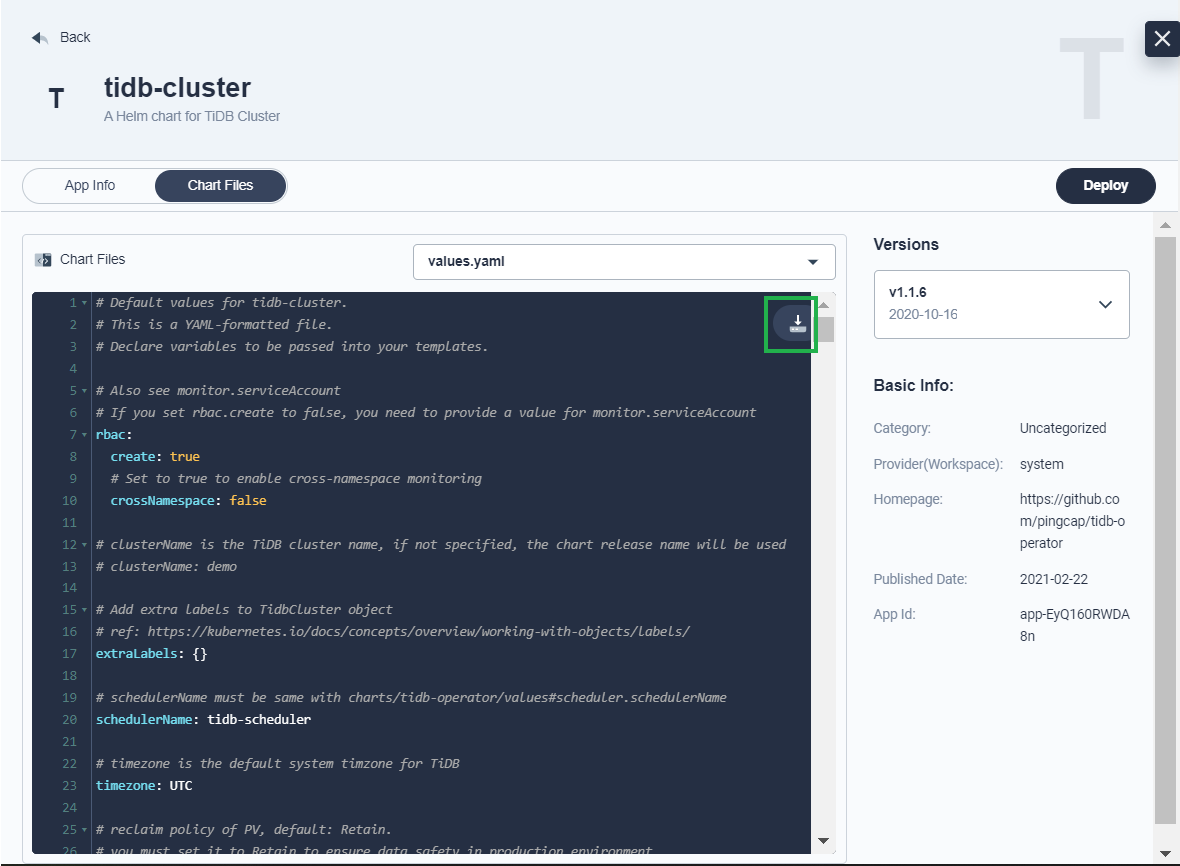
On the Chart Files tab, you can view the configuration from the console directly or download the default
values.yamlfile by clicking the icon in the upper right corner. Under Versions, select a version number from the drop-down list and click Deploy. -
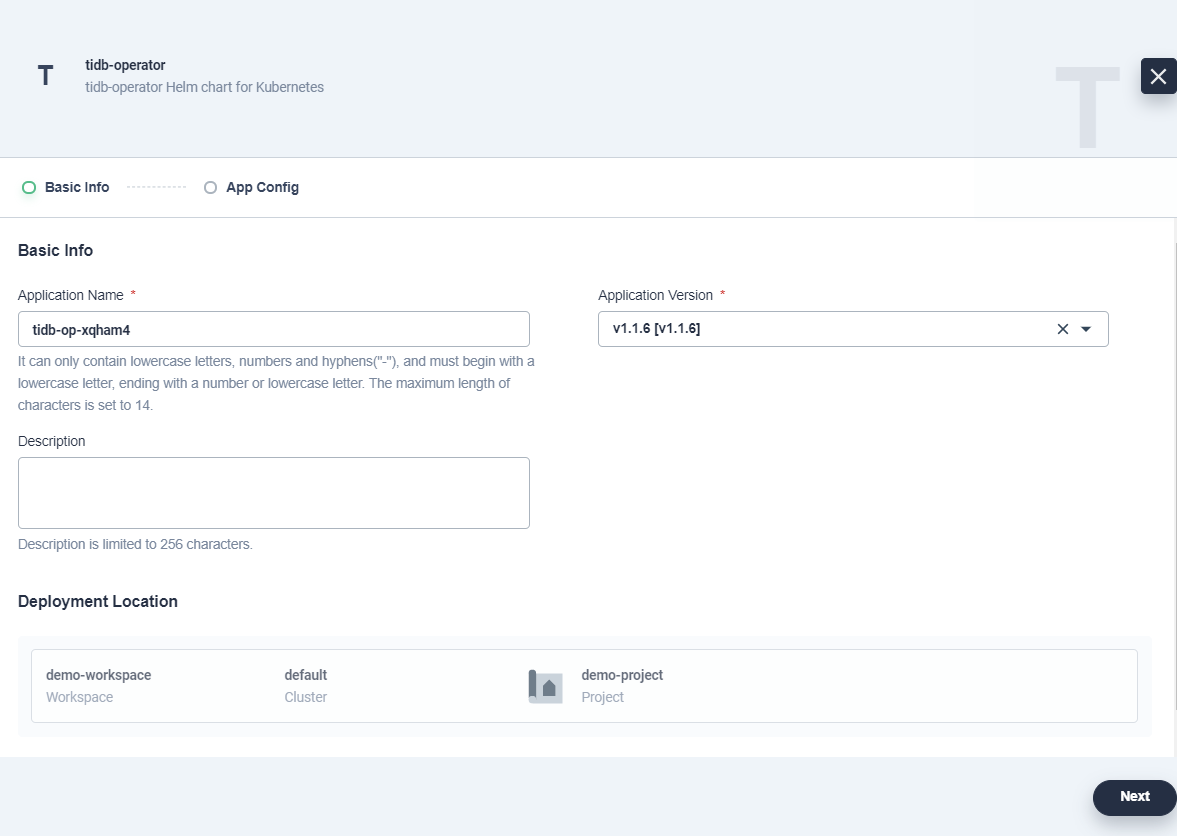
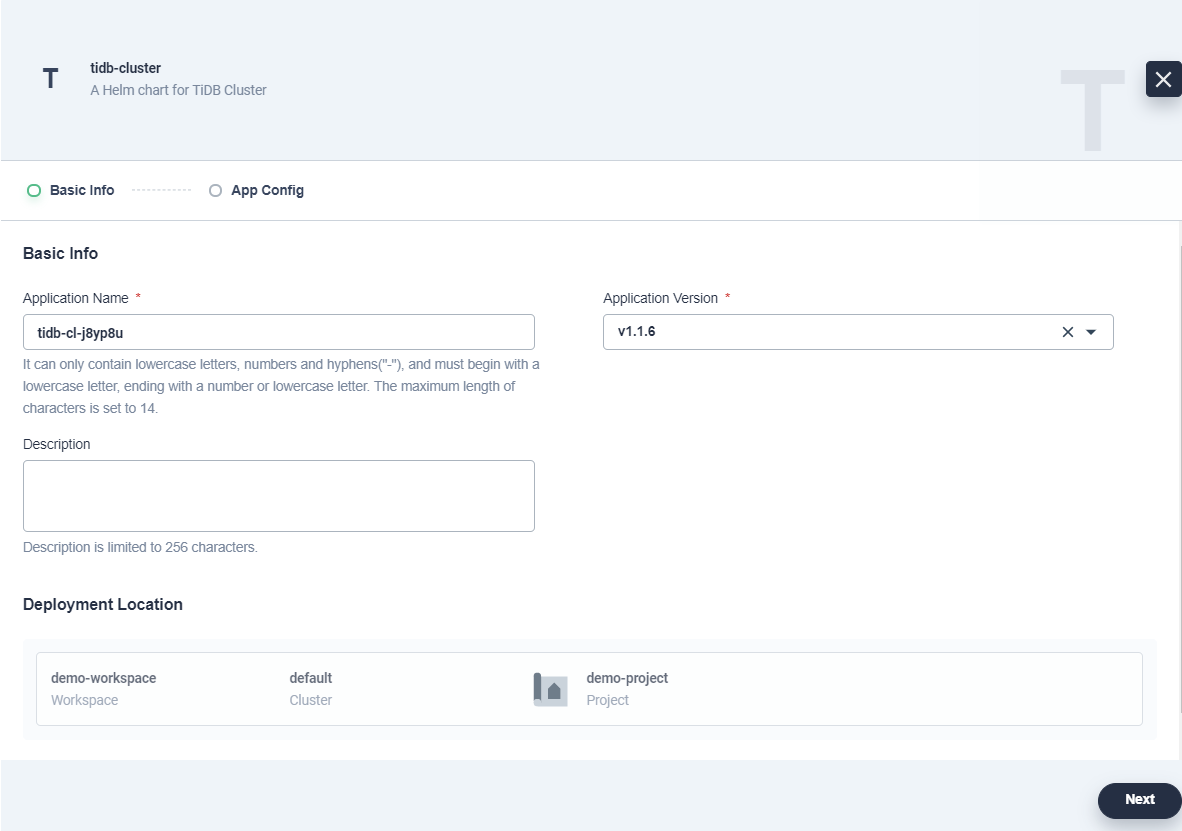
On the Basic Info page, confirm the app name, app version, and deployment location. Click Next to continue.
-
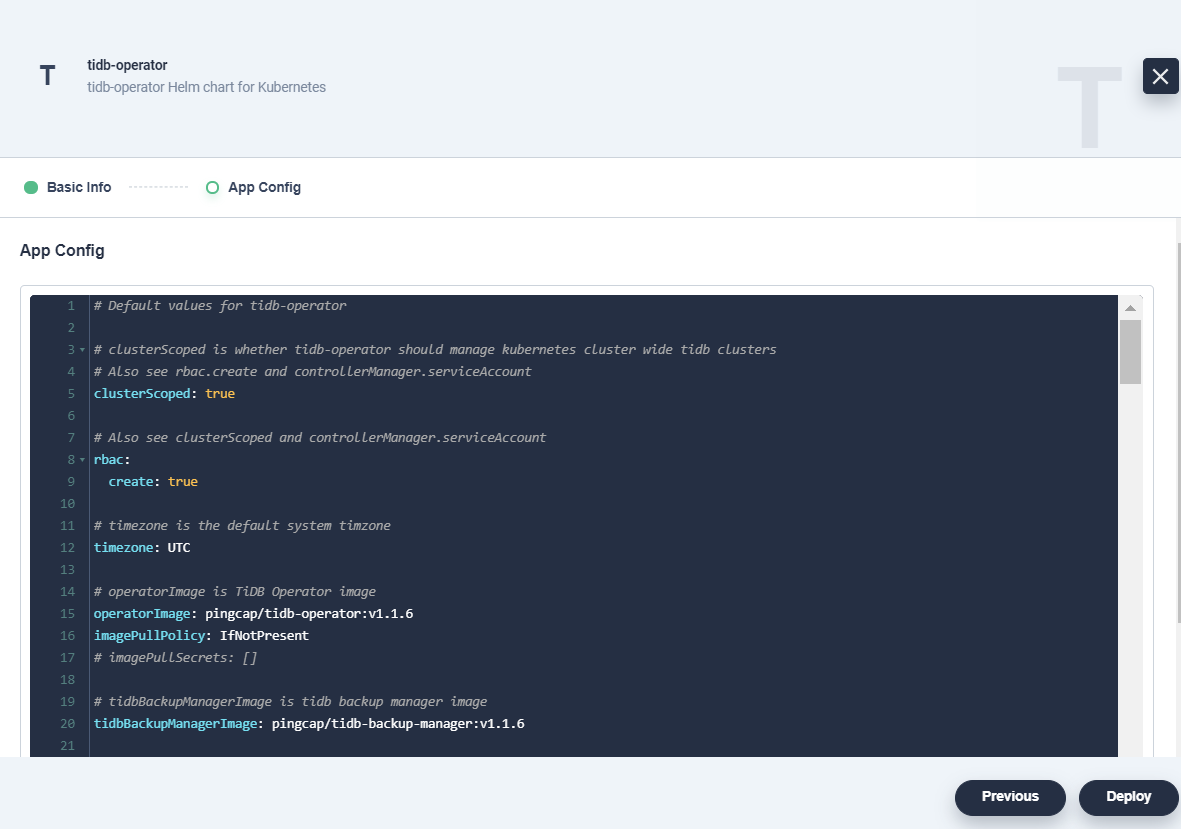
On the App Config page, you can either edit the
values.yamlfile, or click Deploy directly with the default configurations. -
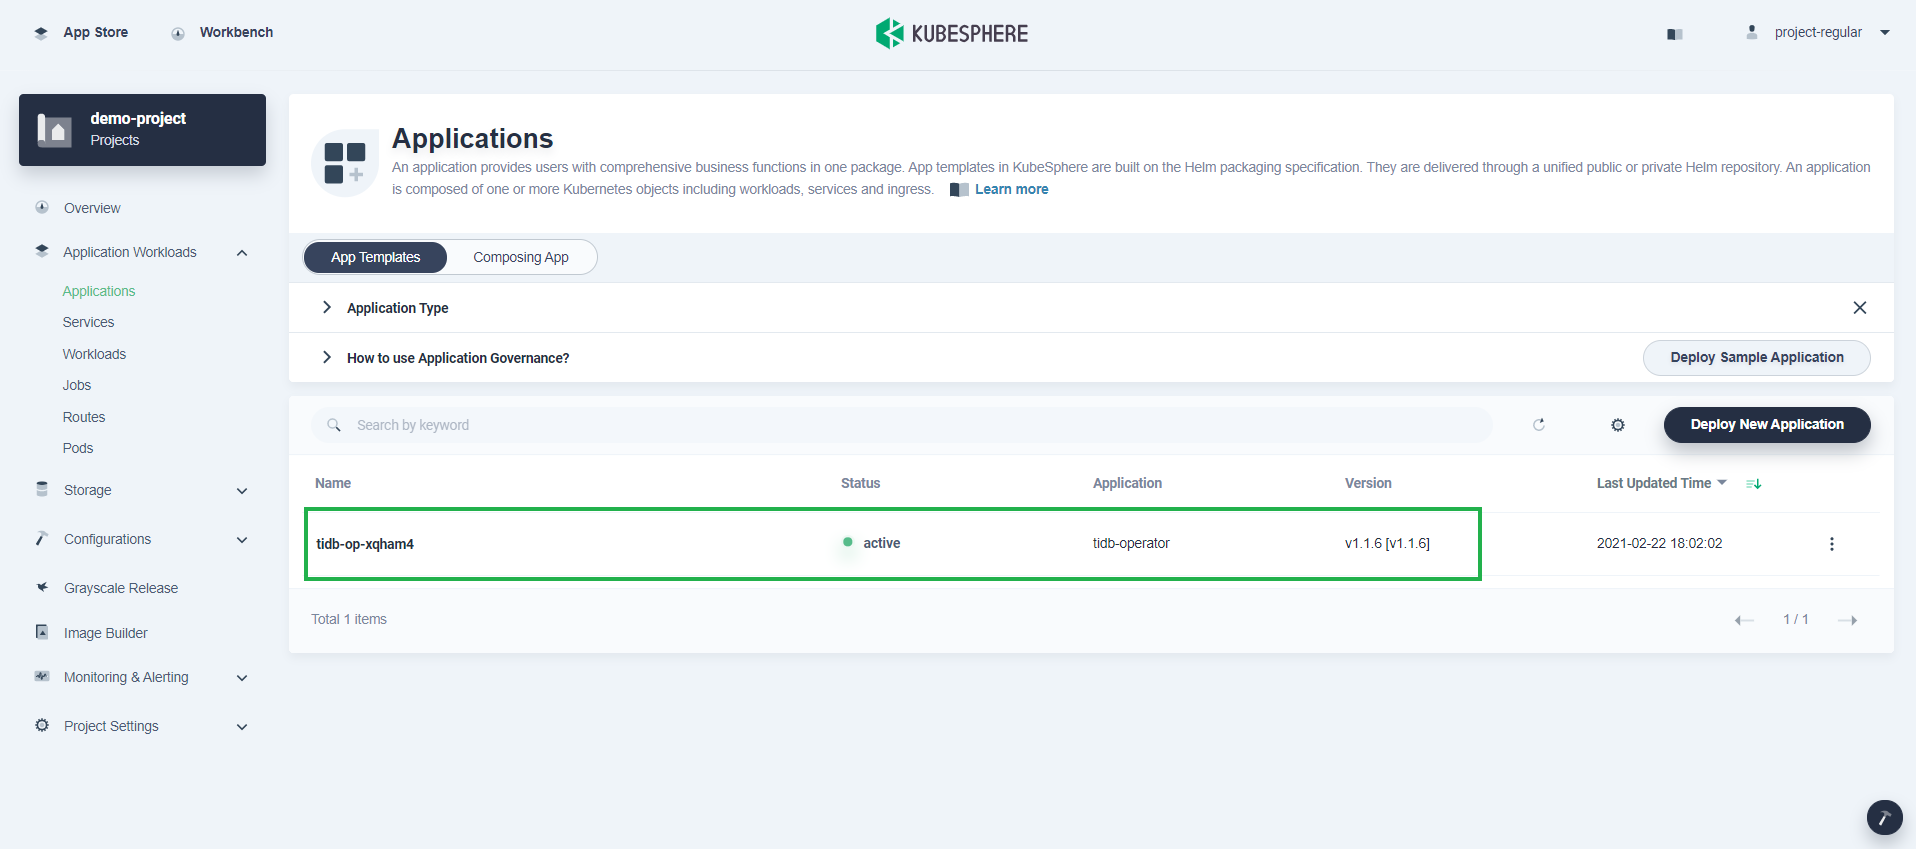
Wait for TiDB Operator to be up and running.
-
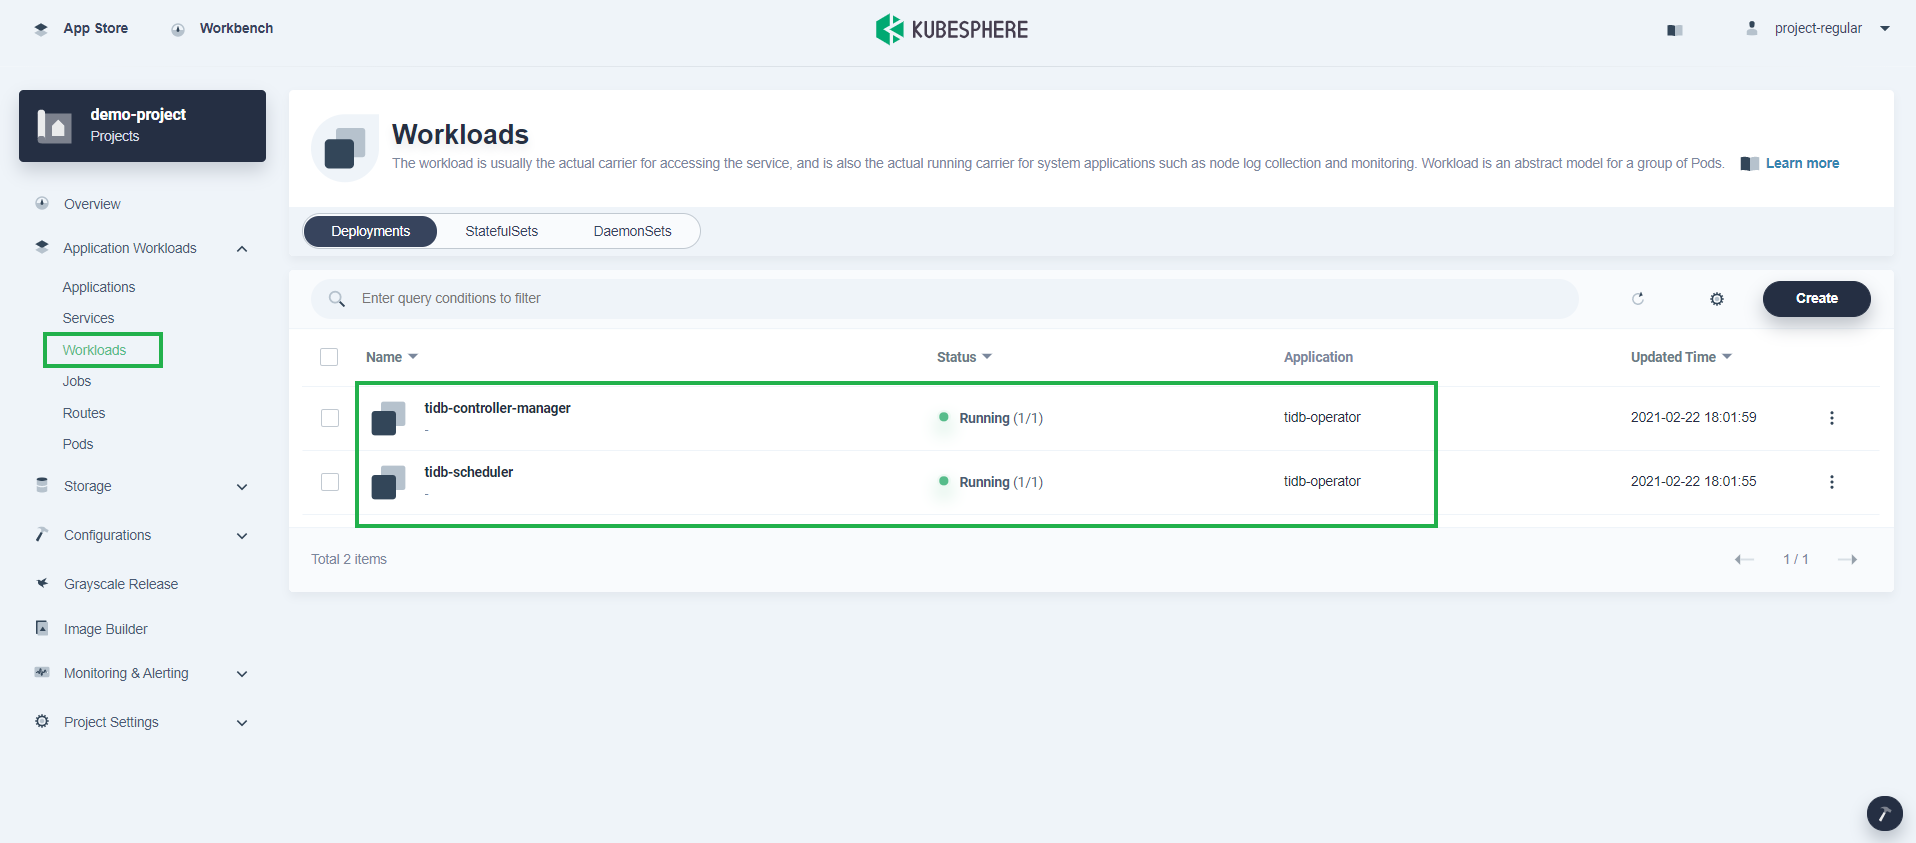
Go to Workloads, and you can see two Deployments created for TiDB Operator.
Step 4: Deploy a TiDB cluster
The process of deploying a TiDB cluster is similar to deploying TiDB Operator.
-
Go to Applications under Application Workloads, click Deploy New Application again, and then select From App Templates.
-
From the PingCAP repository, click tidb-cluster.
-
On the Chart Files tab, you can view the configuration and download the
values.yamlfile. Click Deploy to continue. -
On the Basic Info page, confirm the app name, app version, and deployment location. Click Next to continue.
-
Some TiDB components require persistent volumes. You can run the following command to view your storage classes.
/ # kubectl get sc NAME PROVISIONER RECLAIMPOLICY VOLUMEBINDINGMODE ALLOWVOLUMEEXPANSION AGE csi-high-capacity-legacy csi-qingcloud Delete Immediate true 71m csi-high-perf csi-qingcloud Delete Immediate true 71m csi-ssd-enterprise csi-qingcloud Delete Immediate true 71m csi-standard (default) csi-qingcloud Delete Immediate true 71m csi-super-high-perf csi-qingcloud Delete Immediate true 71m -
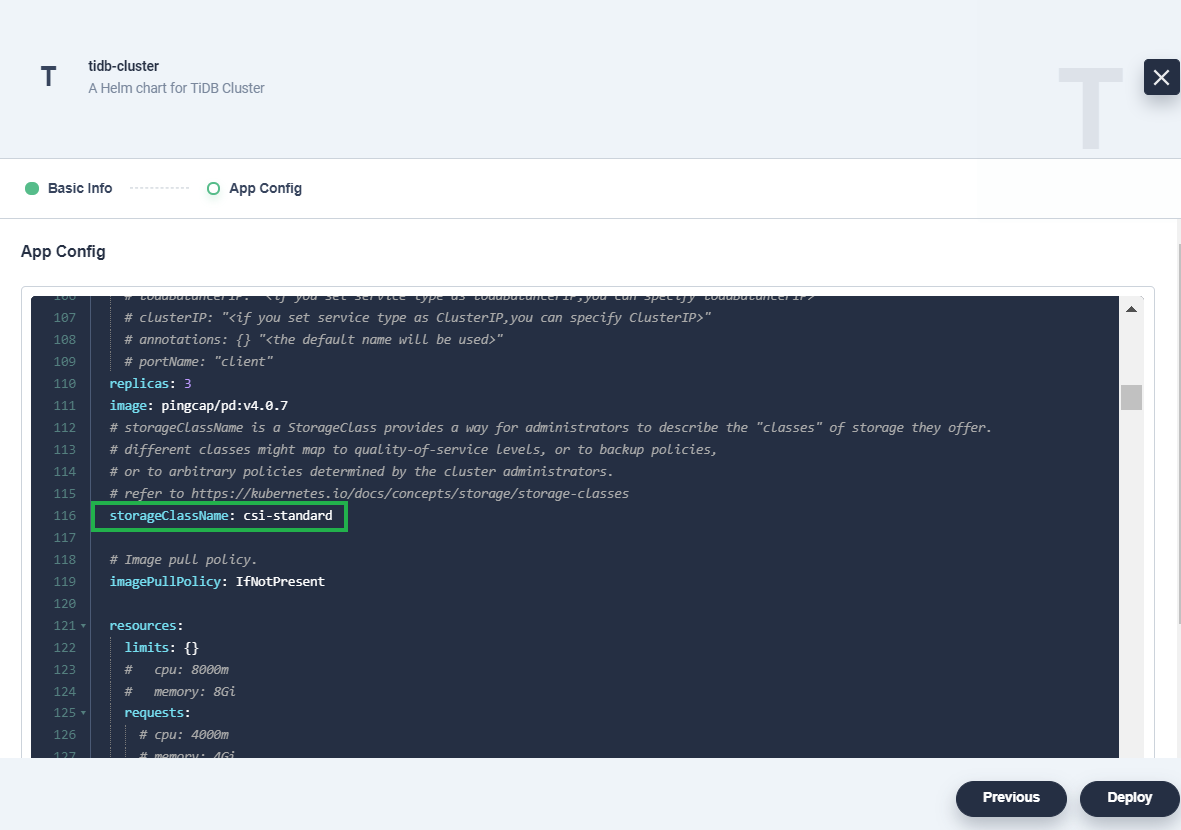
On the App Config page, change all the default values of the field
storageClassNamefromlocal-storageto the name of your storage class. For example, you can change them tocsi-standardbased on the above output.Note
Only the fieldstorageClassNameis changed to provide external persistent storage. If you want to deploy each TiDB component, such as TiKV and Placement Driver, to individual nodes, specify the fieldnodeAffinity. -
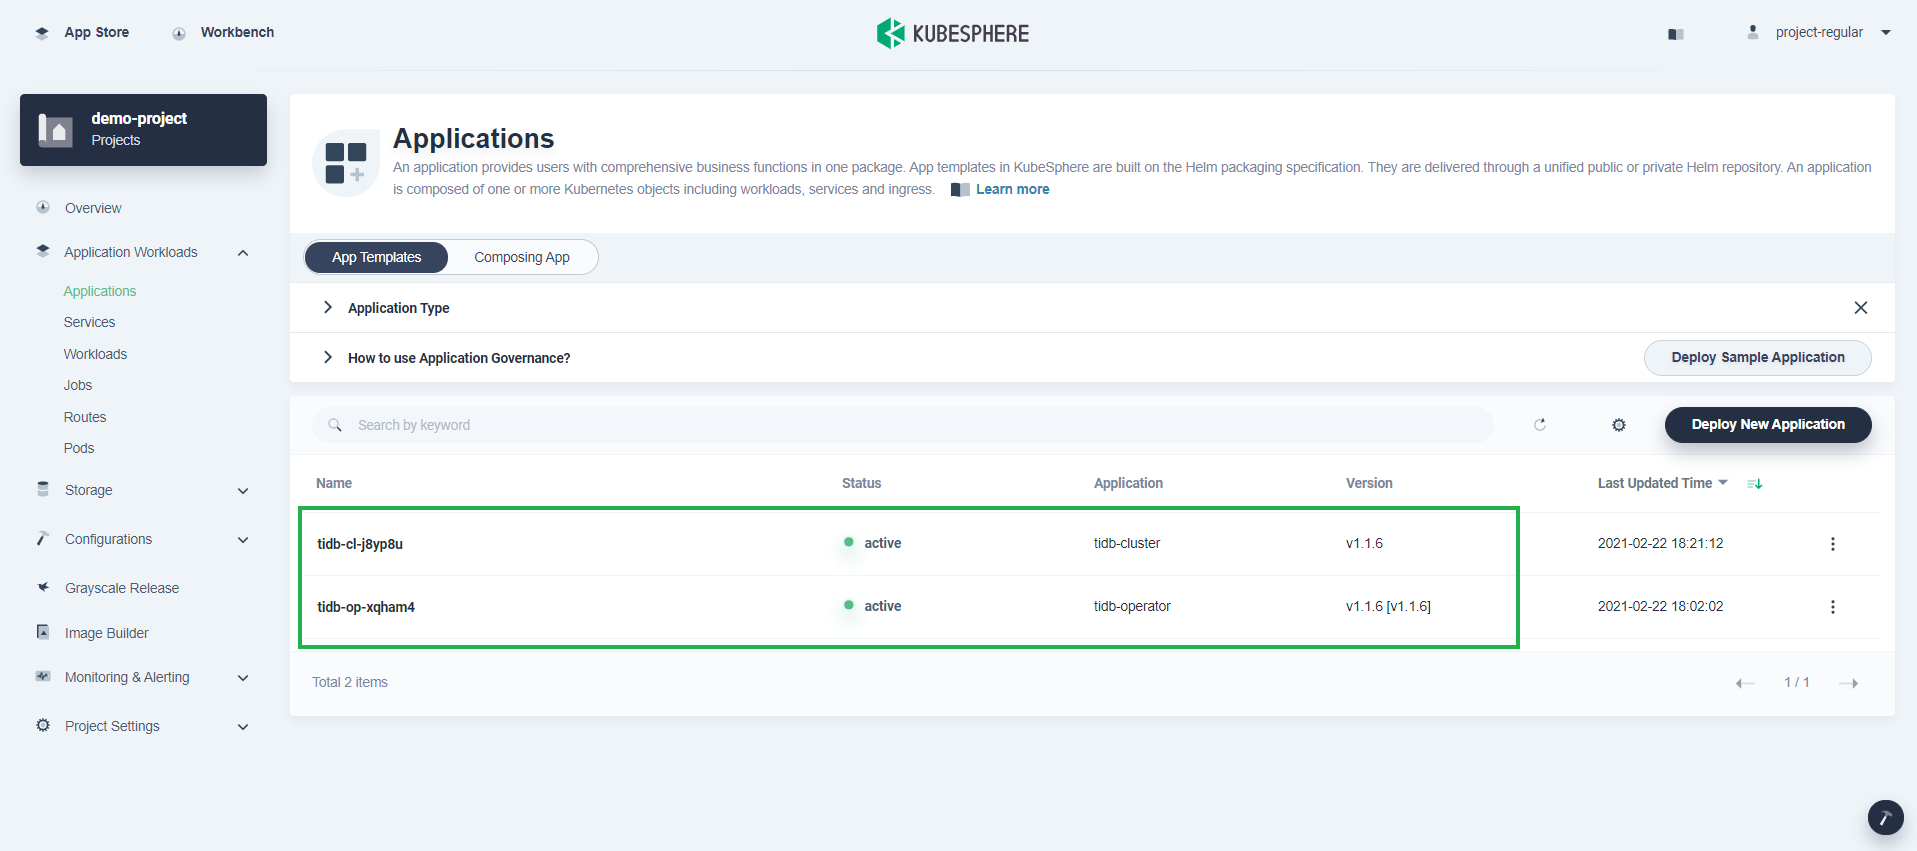
Click Deploy and you can see two apps in the list as shown below:
Step 5: View TiDB cluster status
-
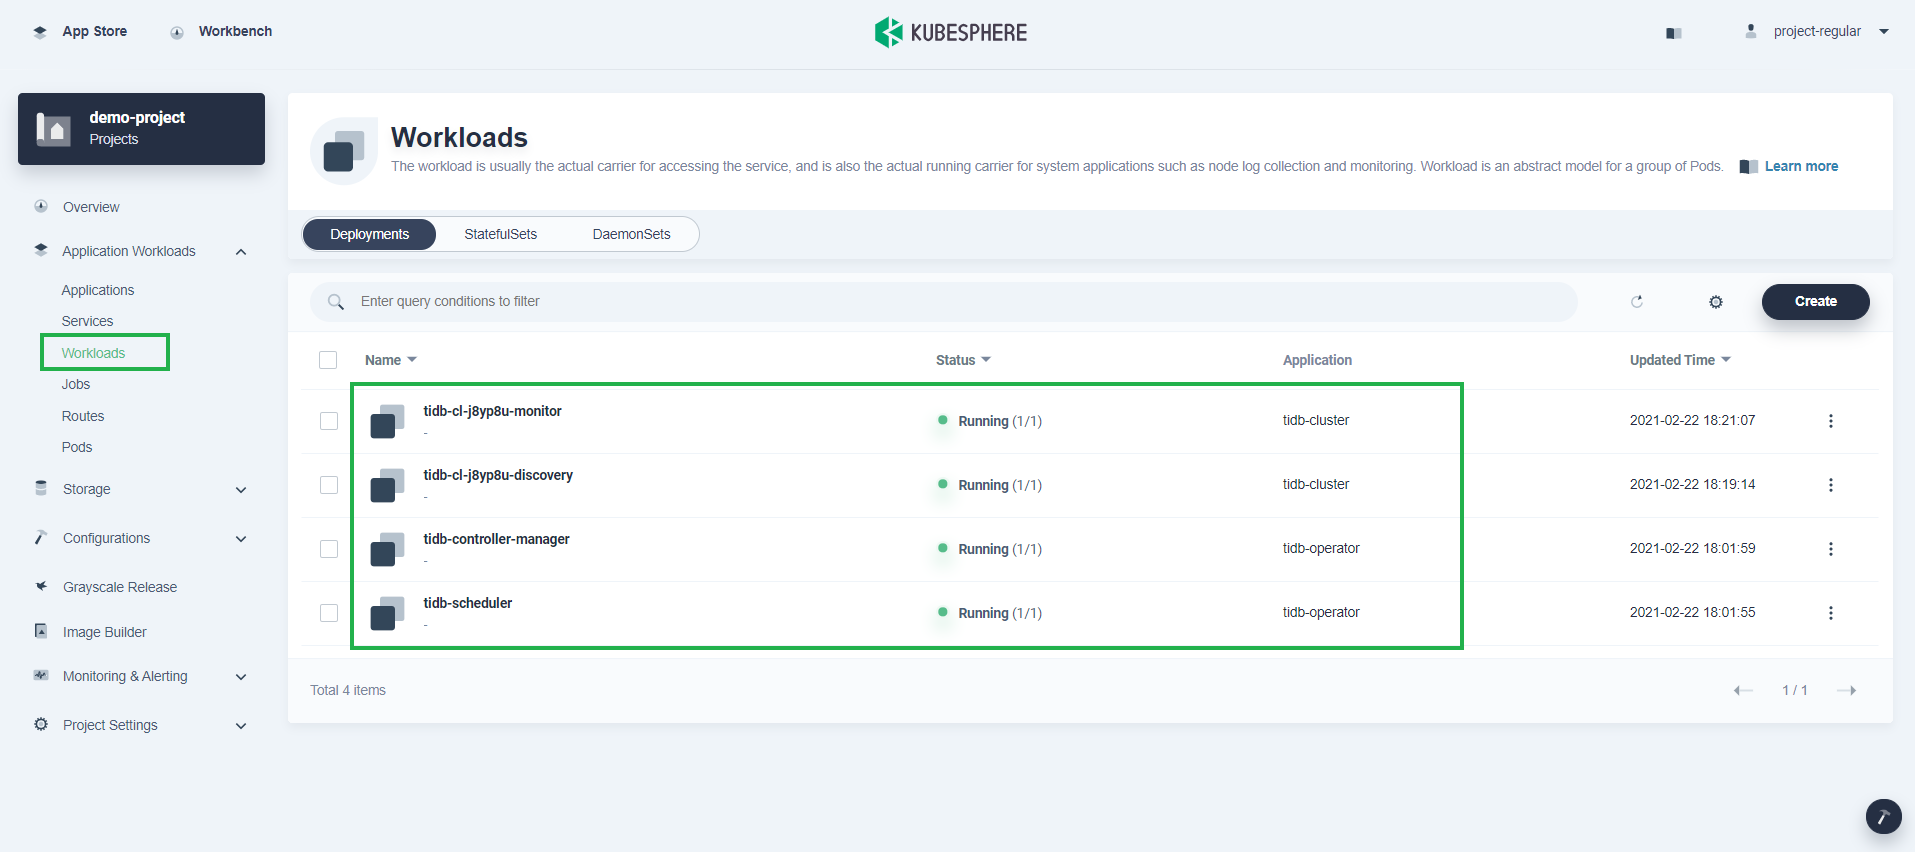
Go to Workloads under Application Workloads, and verify that all TiDB cluster Deployments are up and running.
-
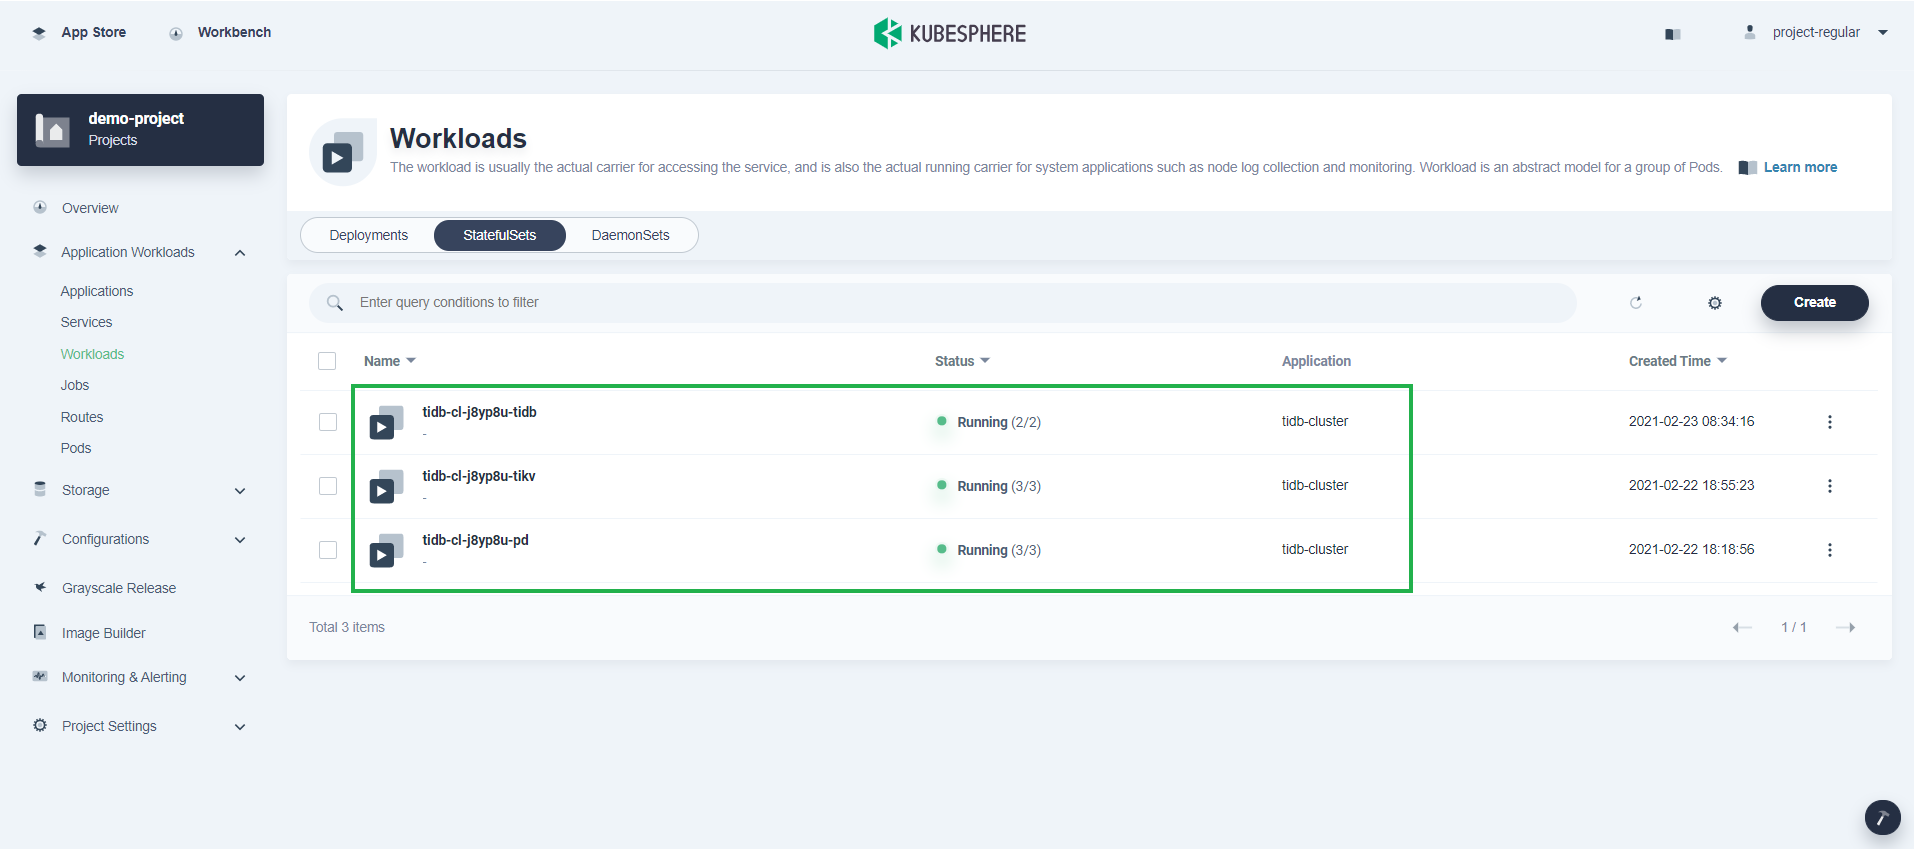
Switch to the StatefulSets tab, and you can see TiDB, TiKV and PD are up and running.
Note
TiKV and TiDB will be created automatically and it may take a while before they display in the list. -
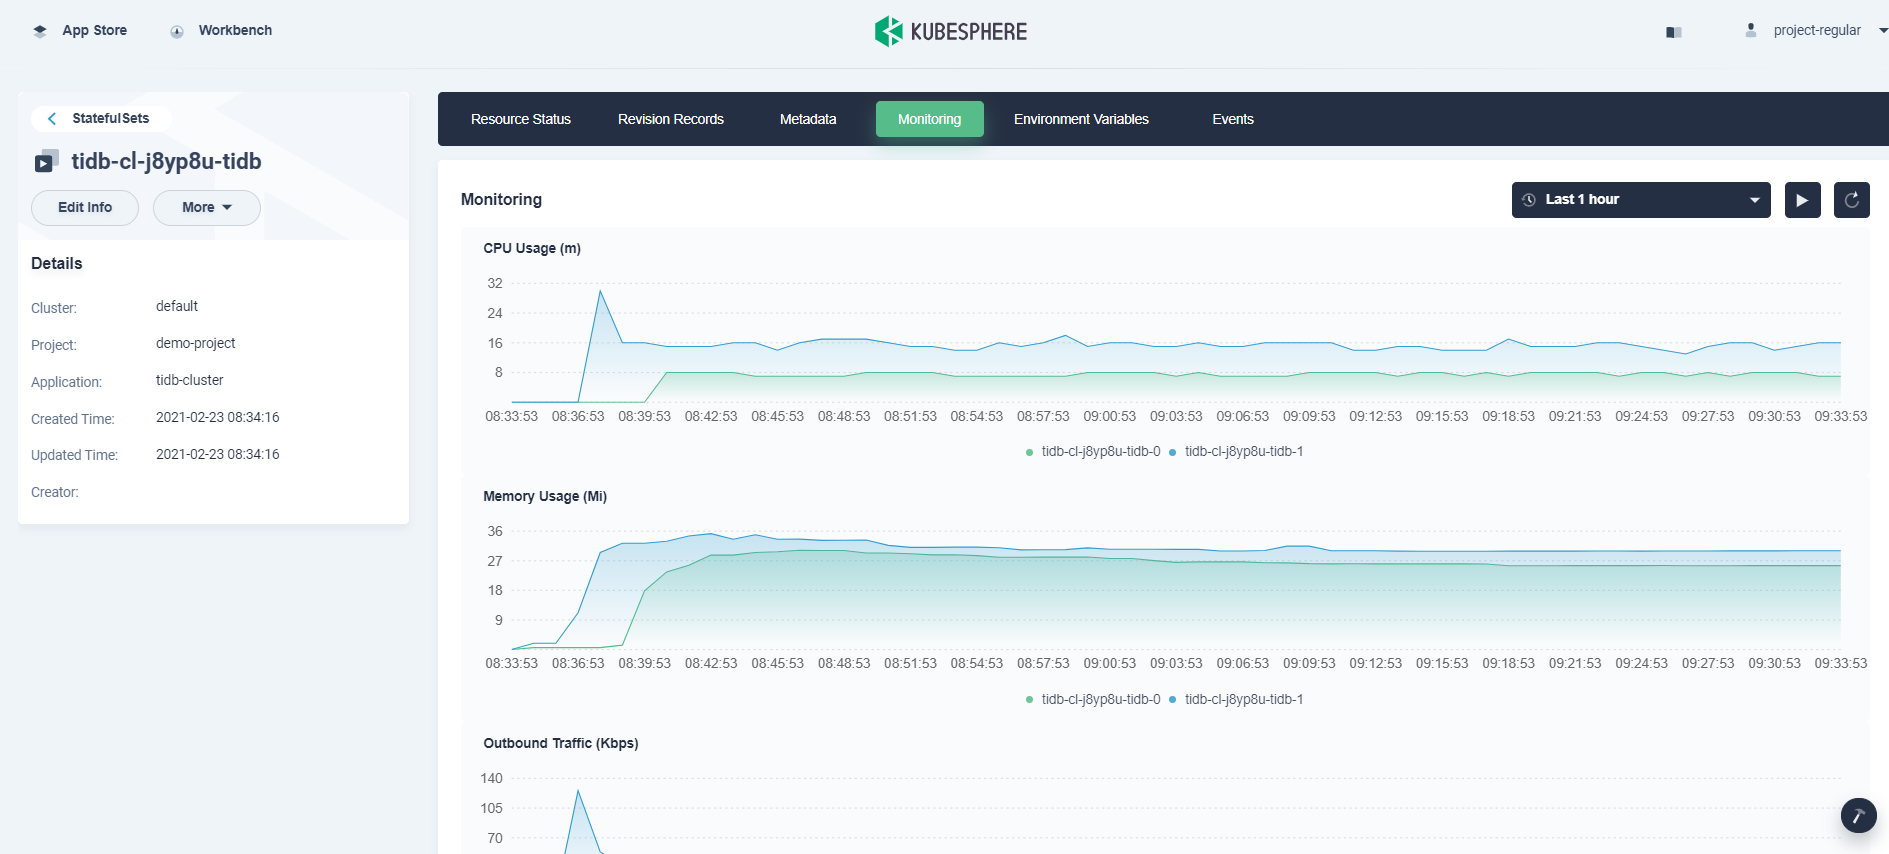
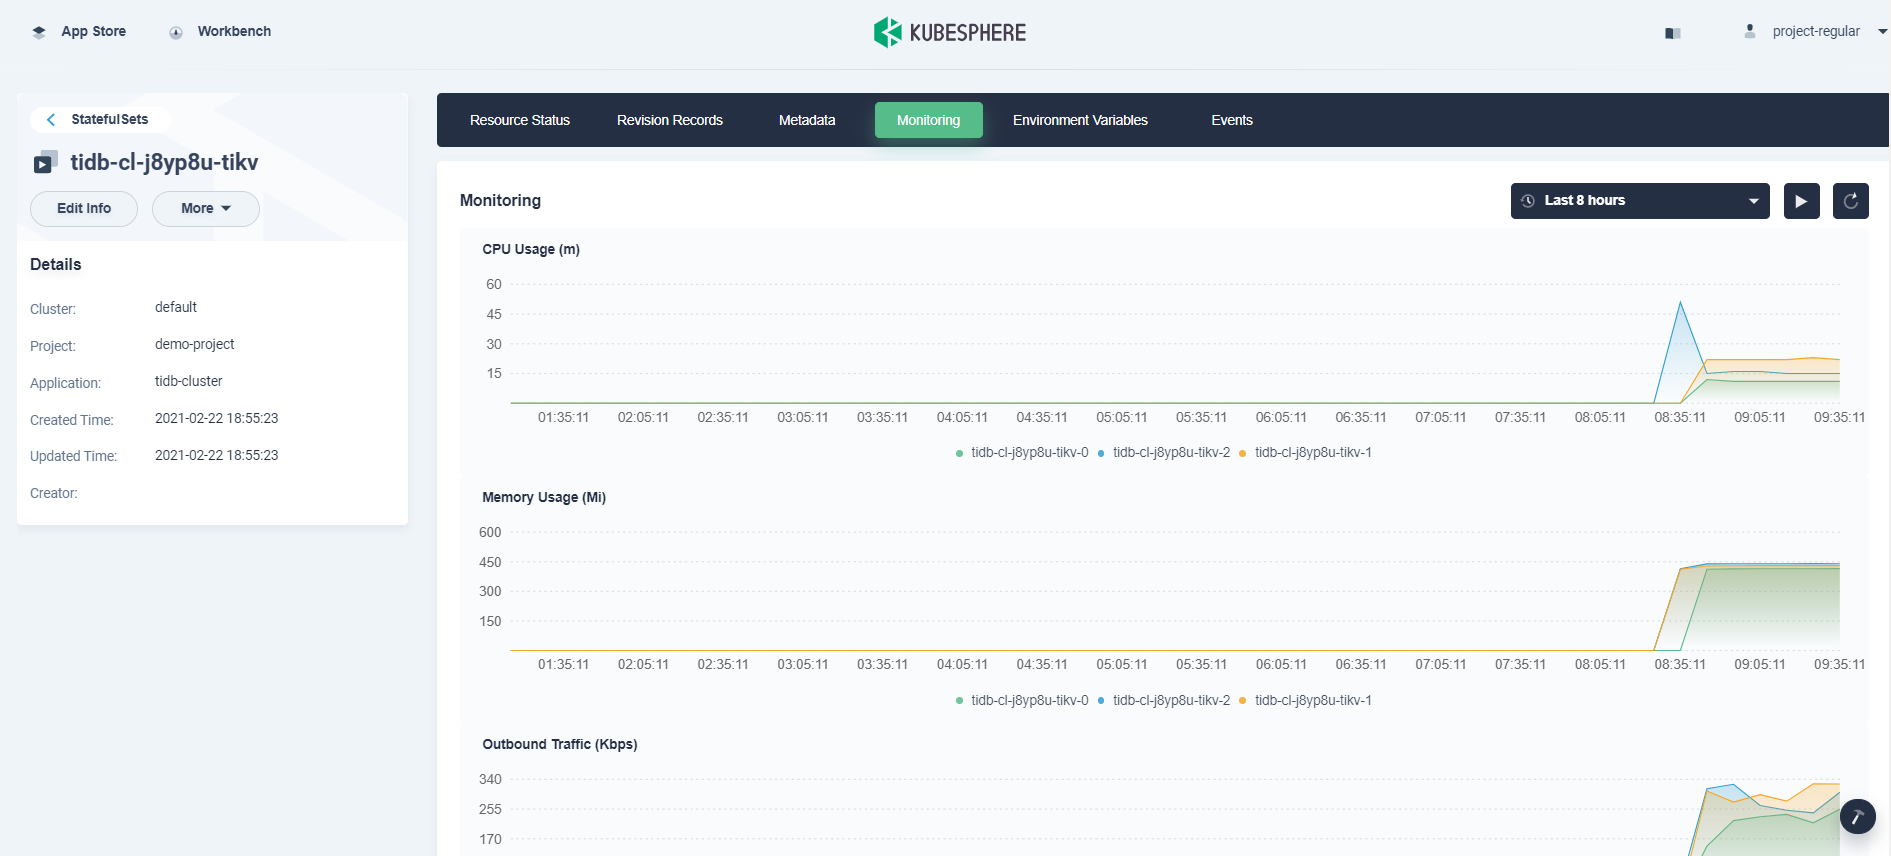
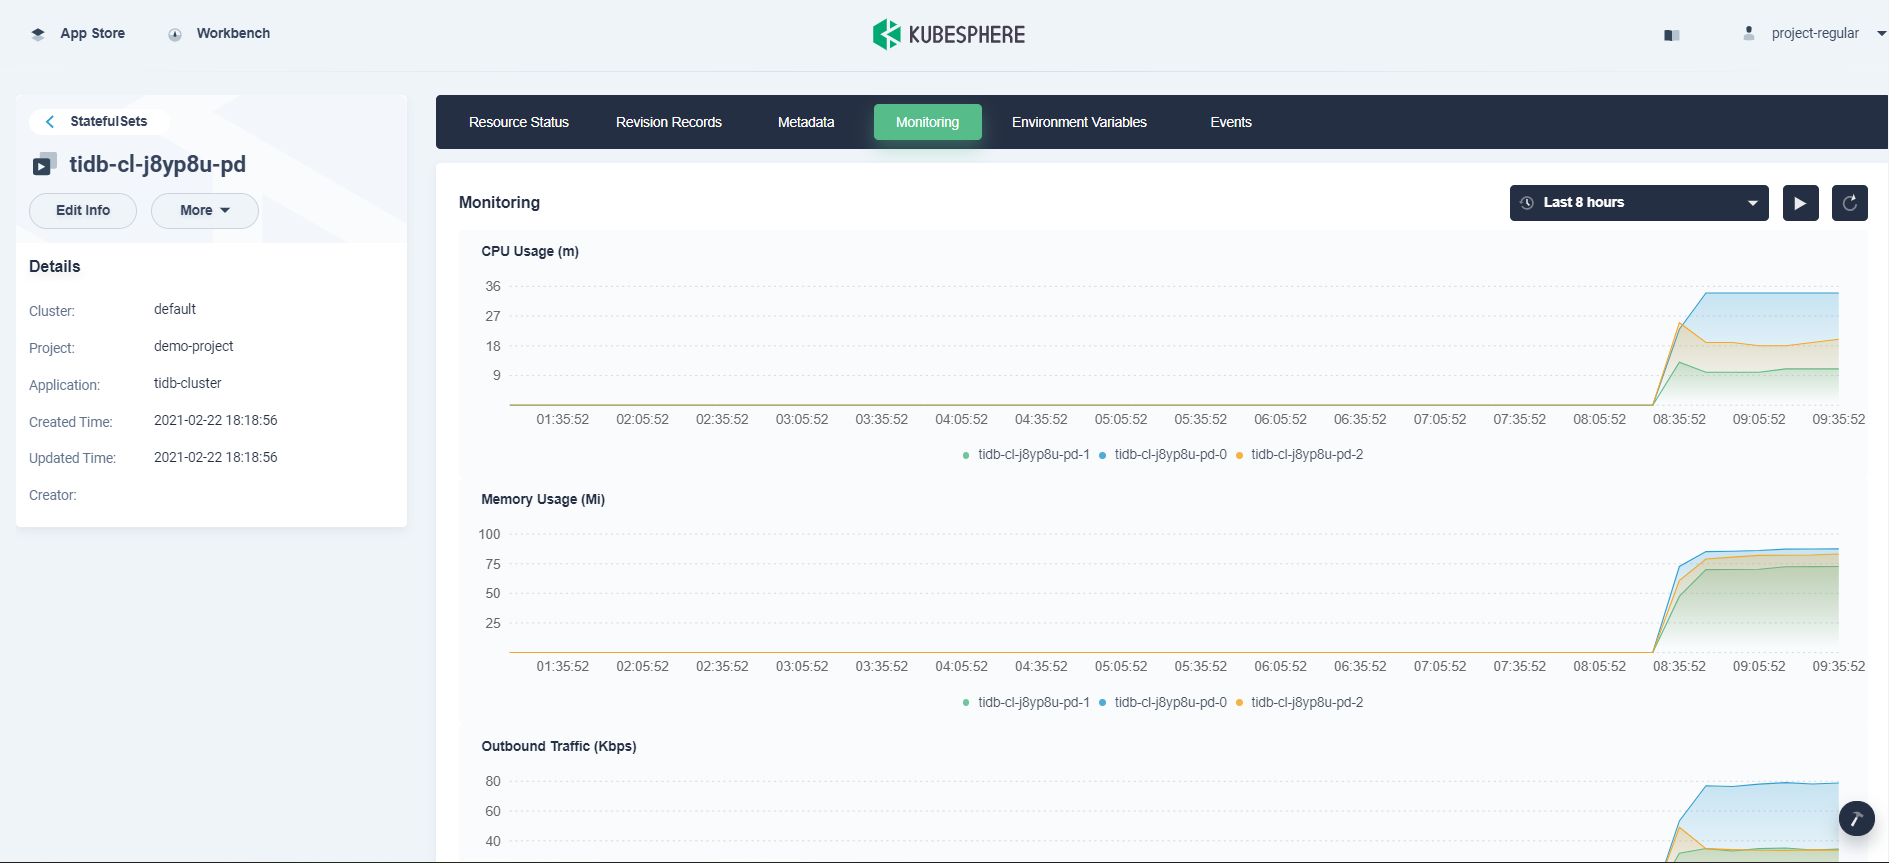
Click a single StatefulSet to go to its detail page. You can see the metrics in line charts over a period of time under the Monitoring tab.
TiDB metrics:
TiKV metrics:
PD metrics:
-
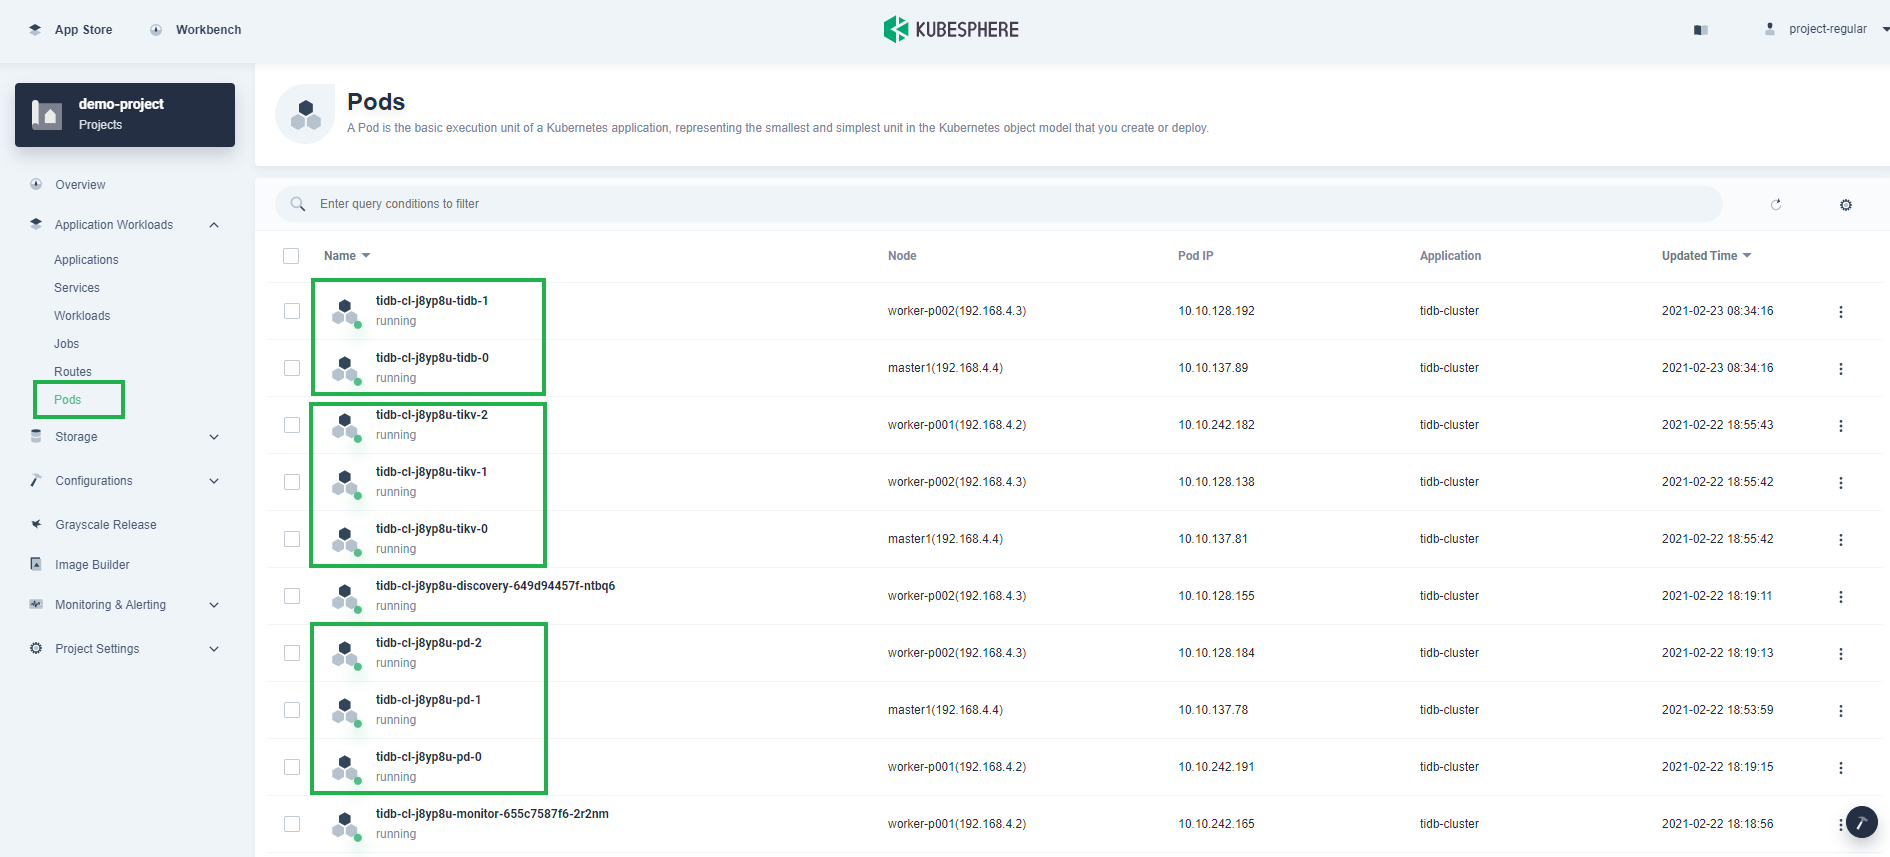
In Pods under Application Workloads, you can see the TiDB cluster contains two TiDB Pods, three TiKV Pods, and three PD Pods.
-
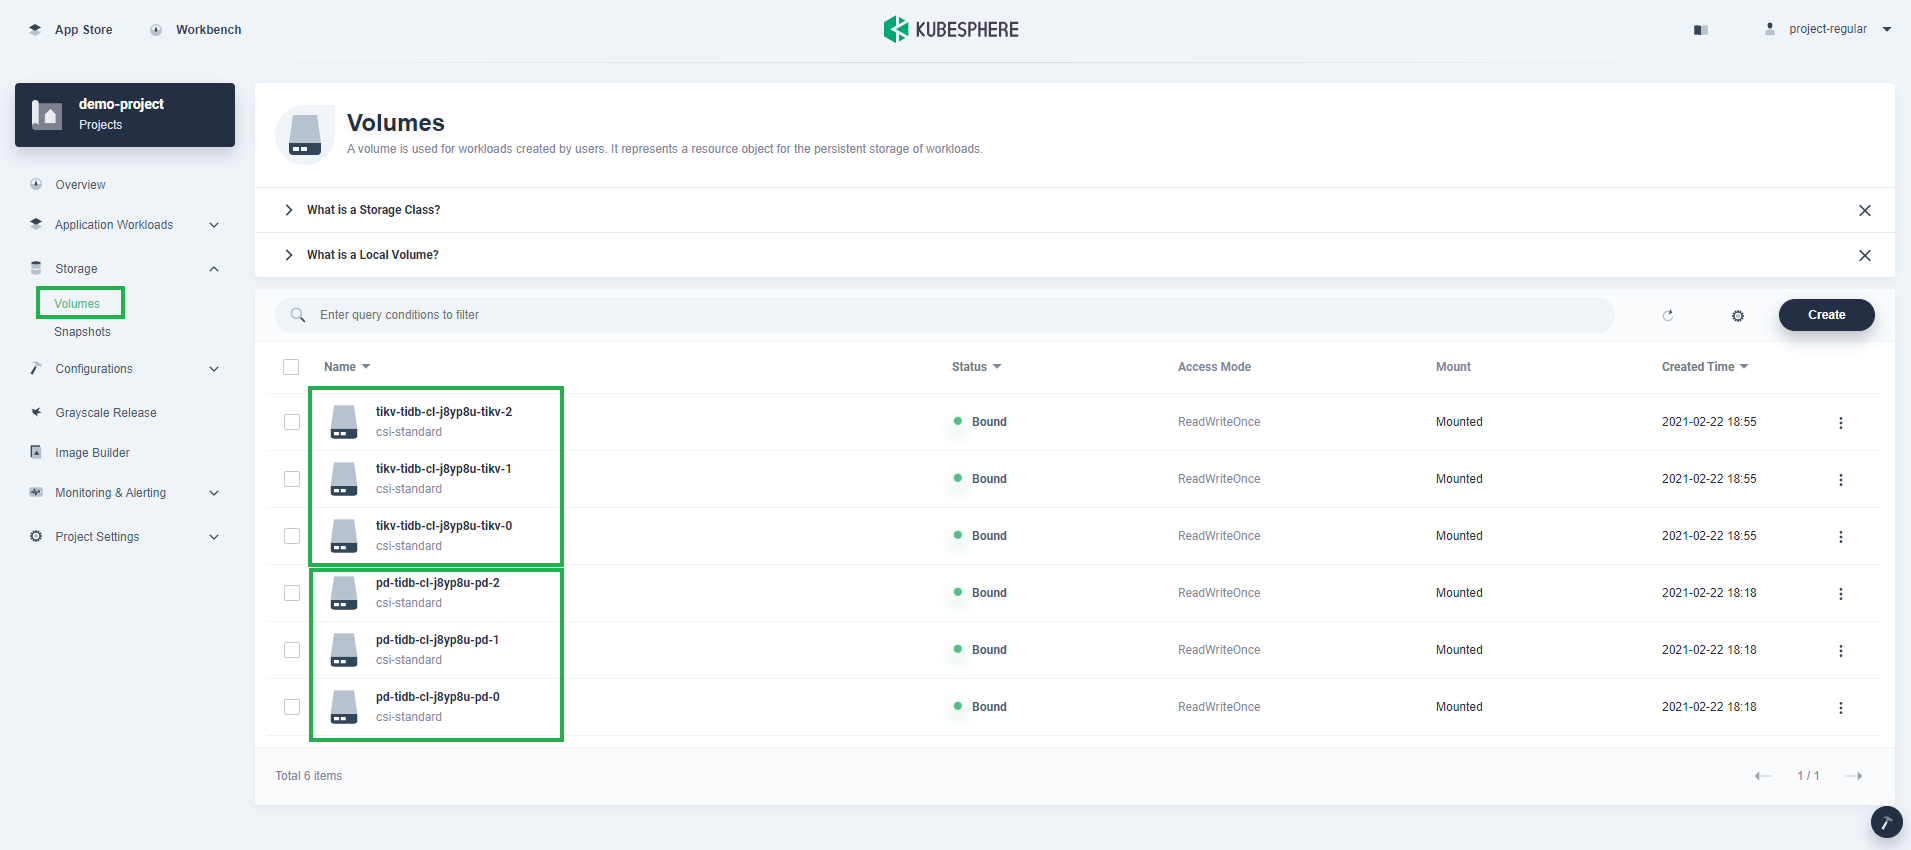
In Volumes under Storage, you can see TiKV and PD are using persistent volumes.
-
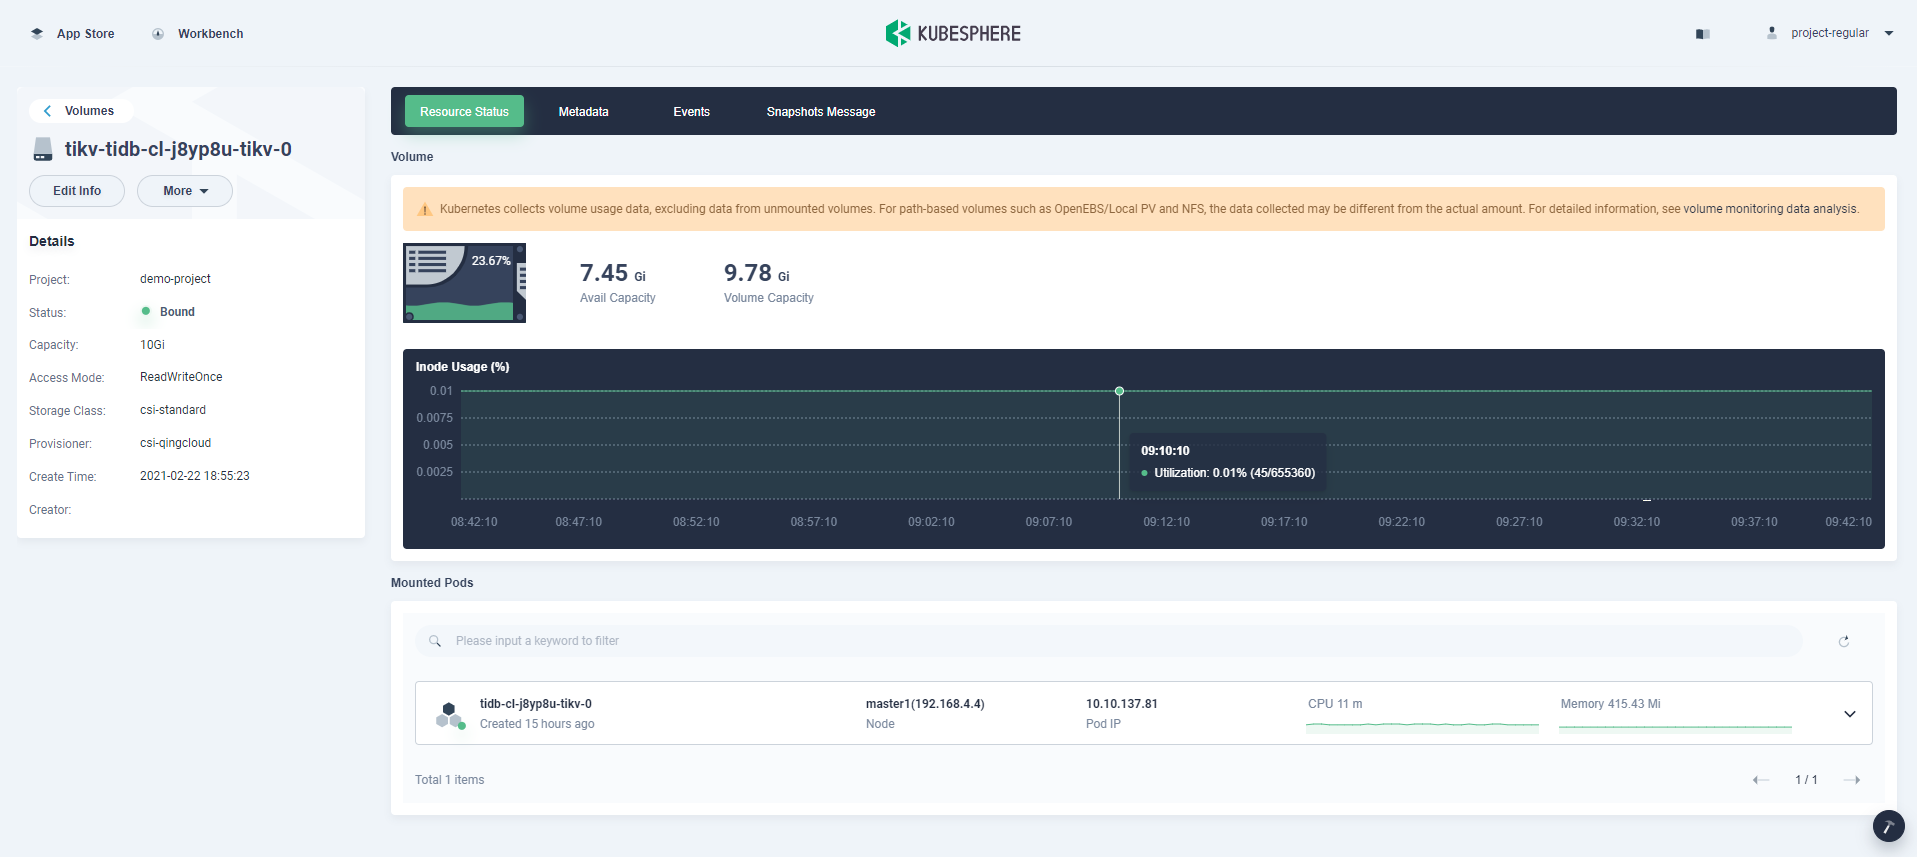
Volume usage is also monitored. Click a volume item to go to its detail page. Here is an example of TiKV:
-
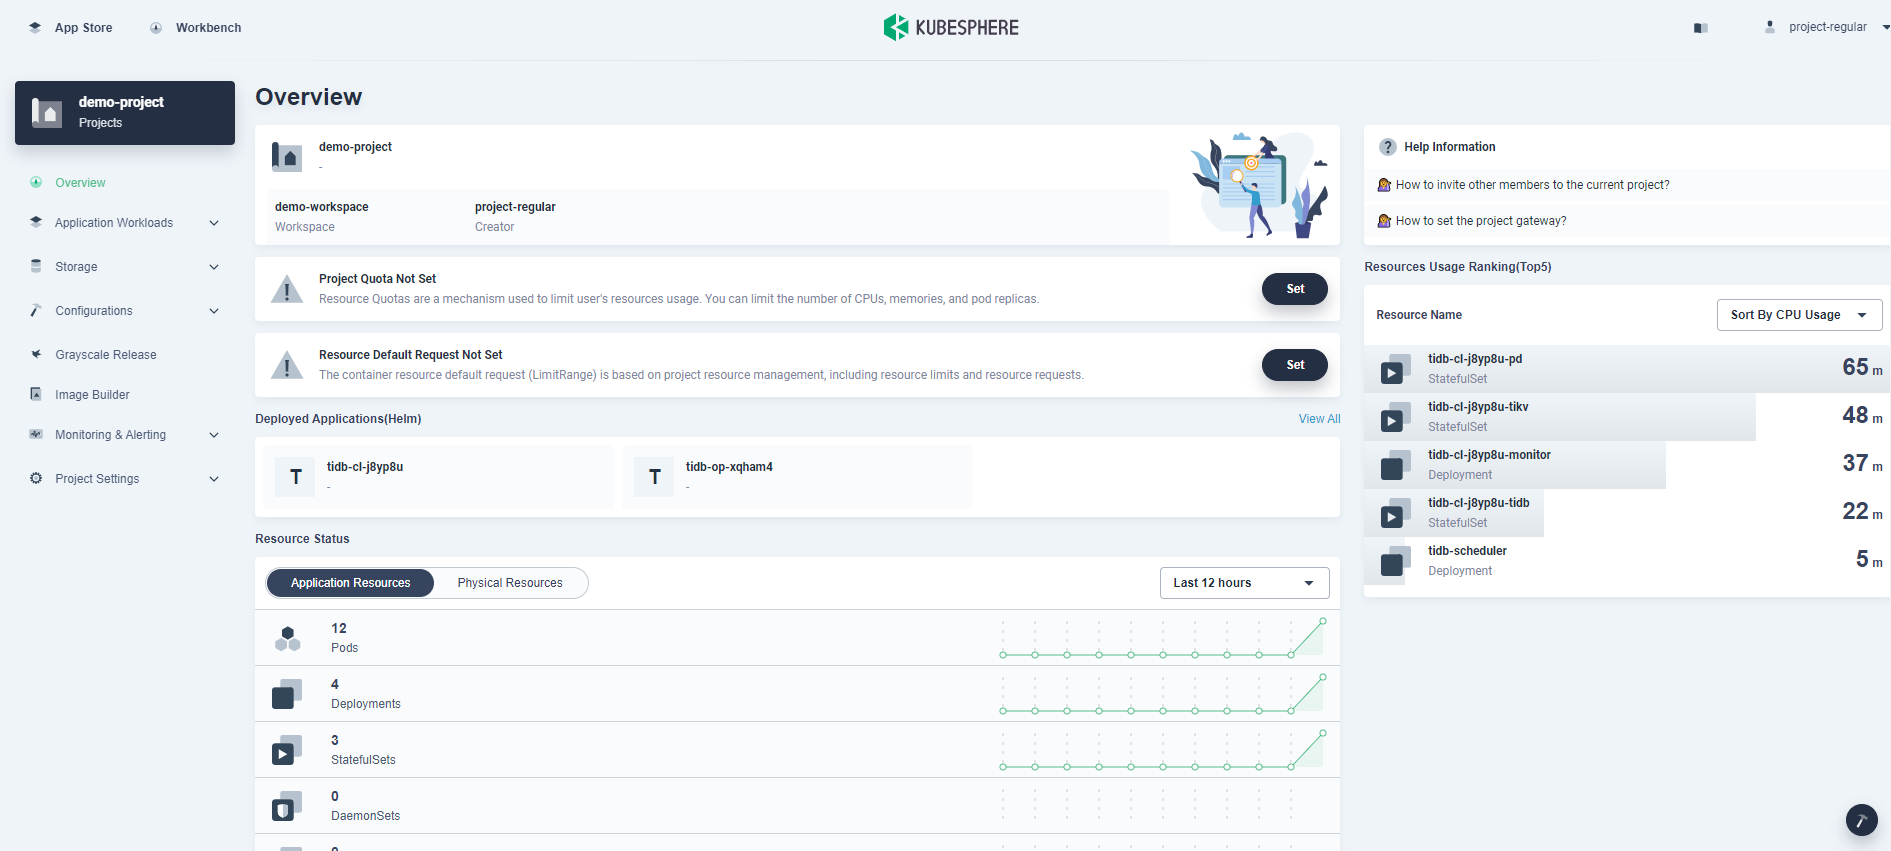
On the Overview page of the project, you can see a list of resource usage in the current project.
Step 6: Access the TiDB cluster
-
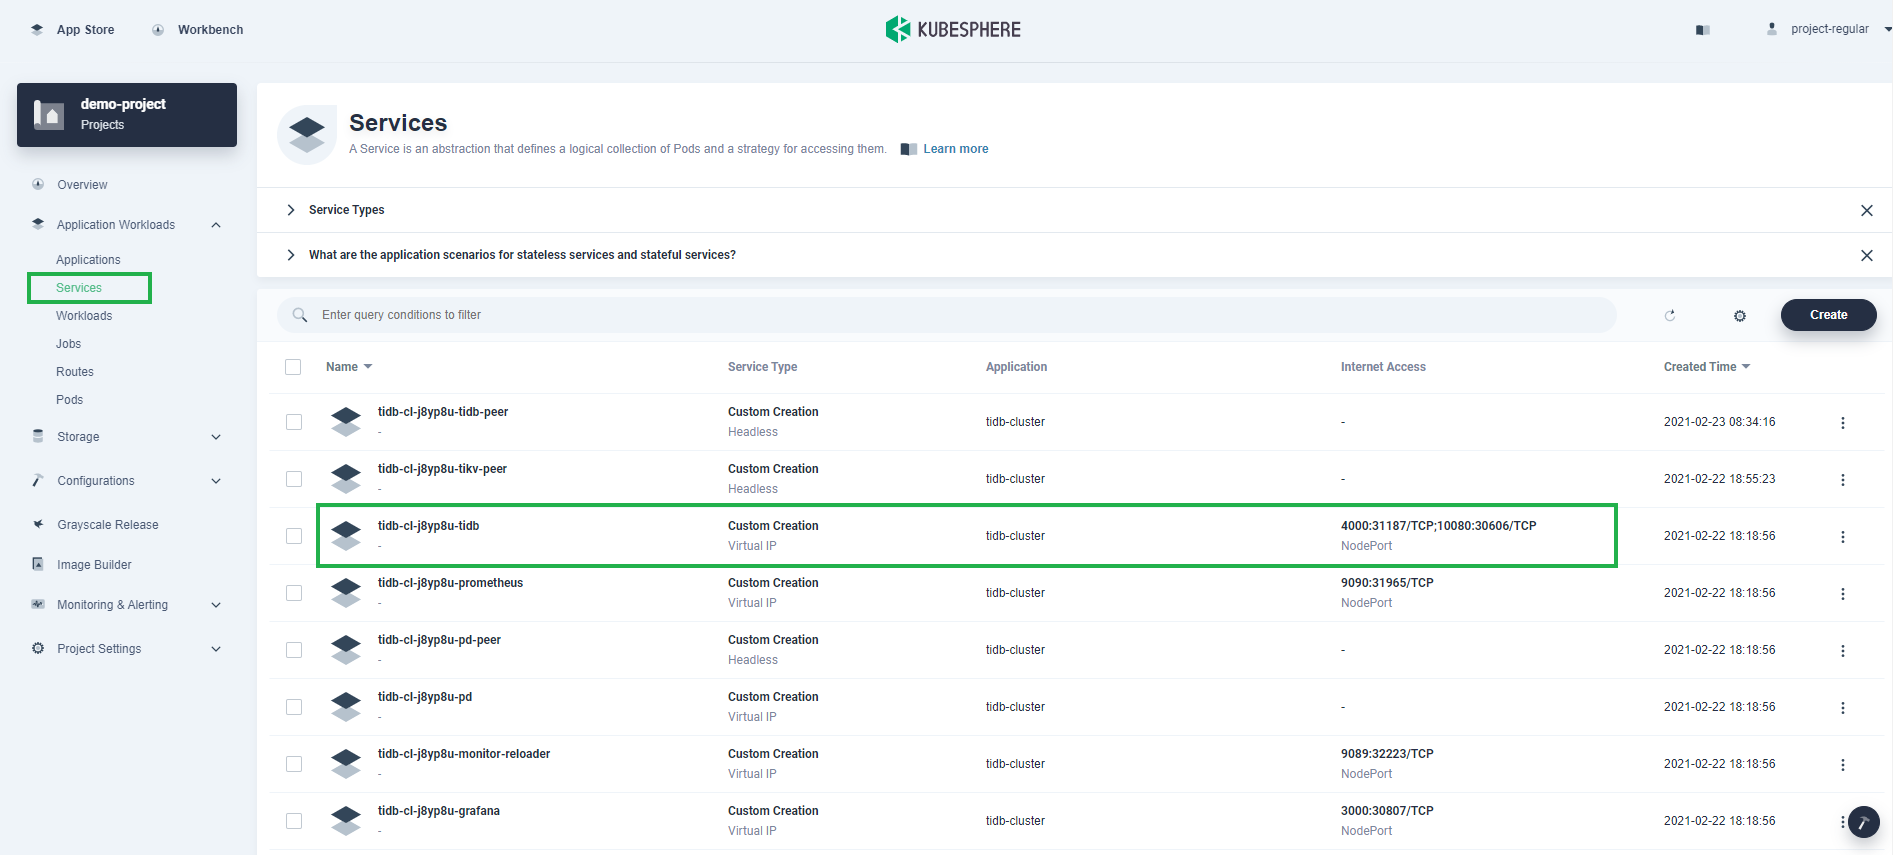
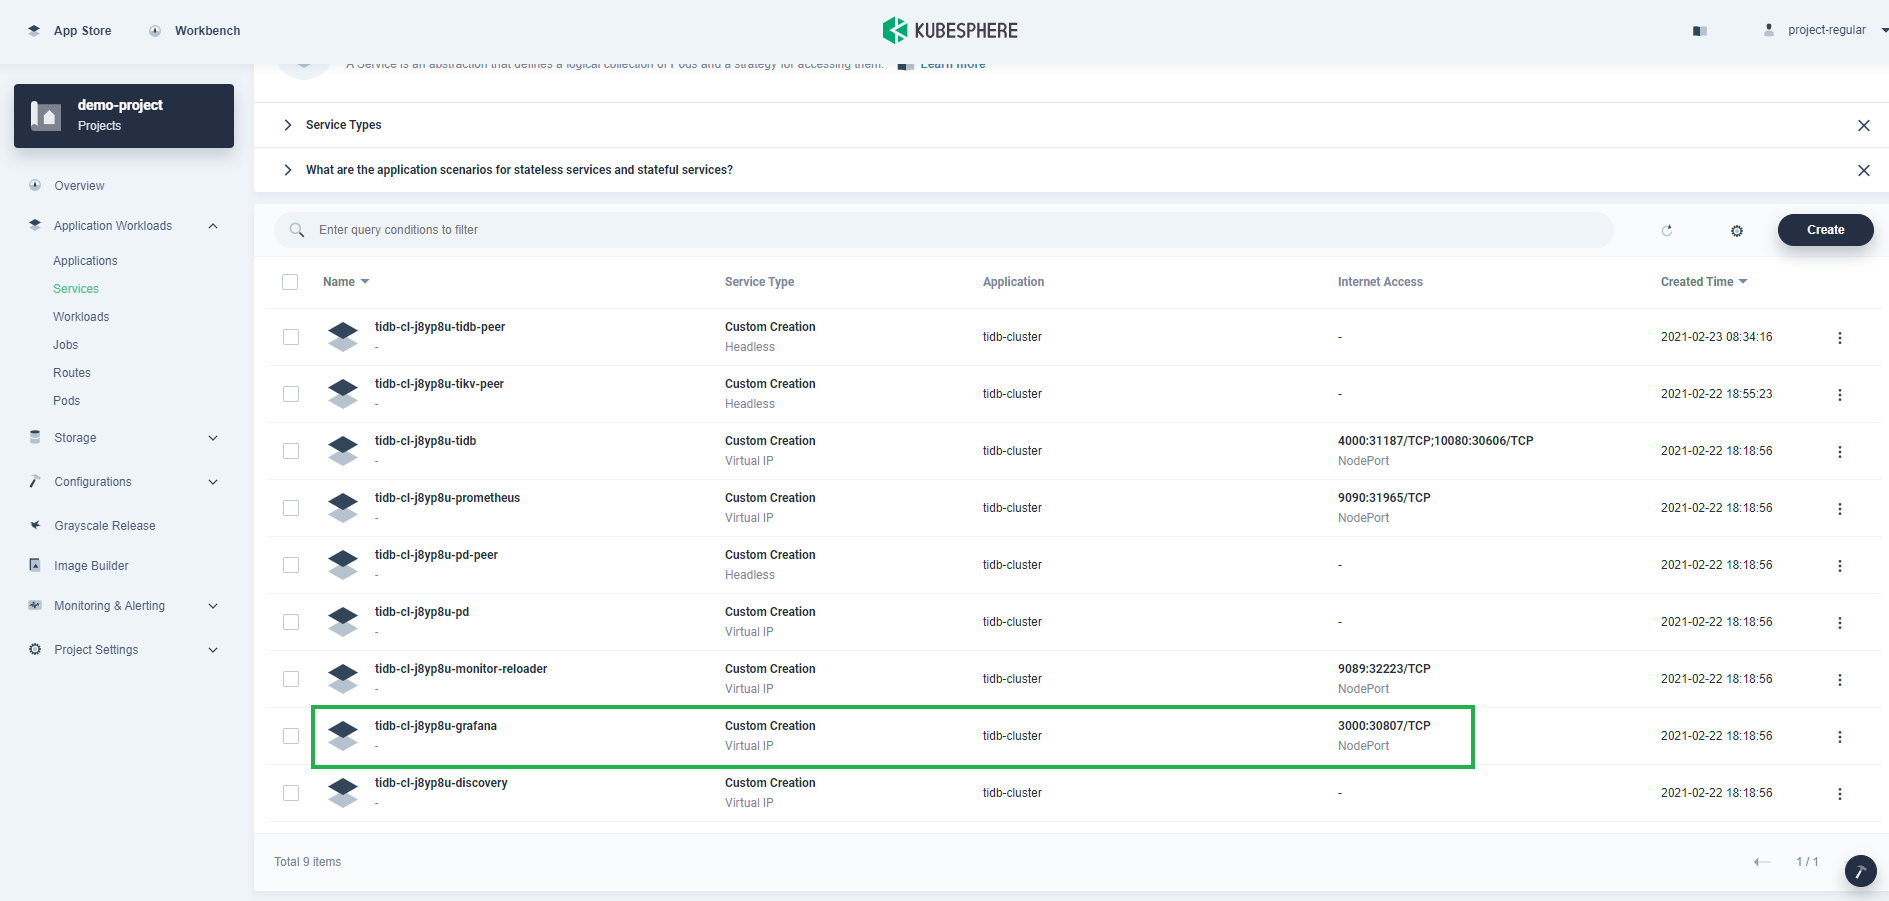
Go to Services under Application Workloads, and you can see detailed information of all Services. As the Service type is set to
NodePortby default, you can access it through the Node IP address outside the cluster. -
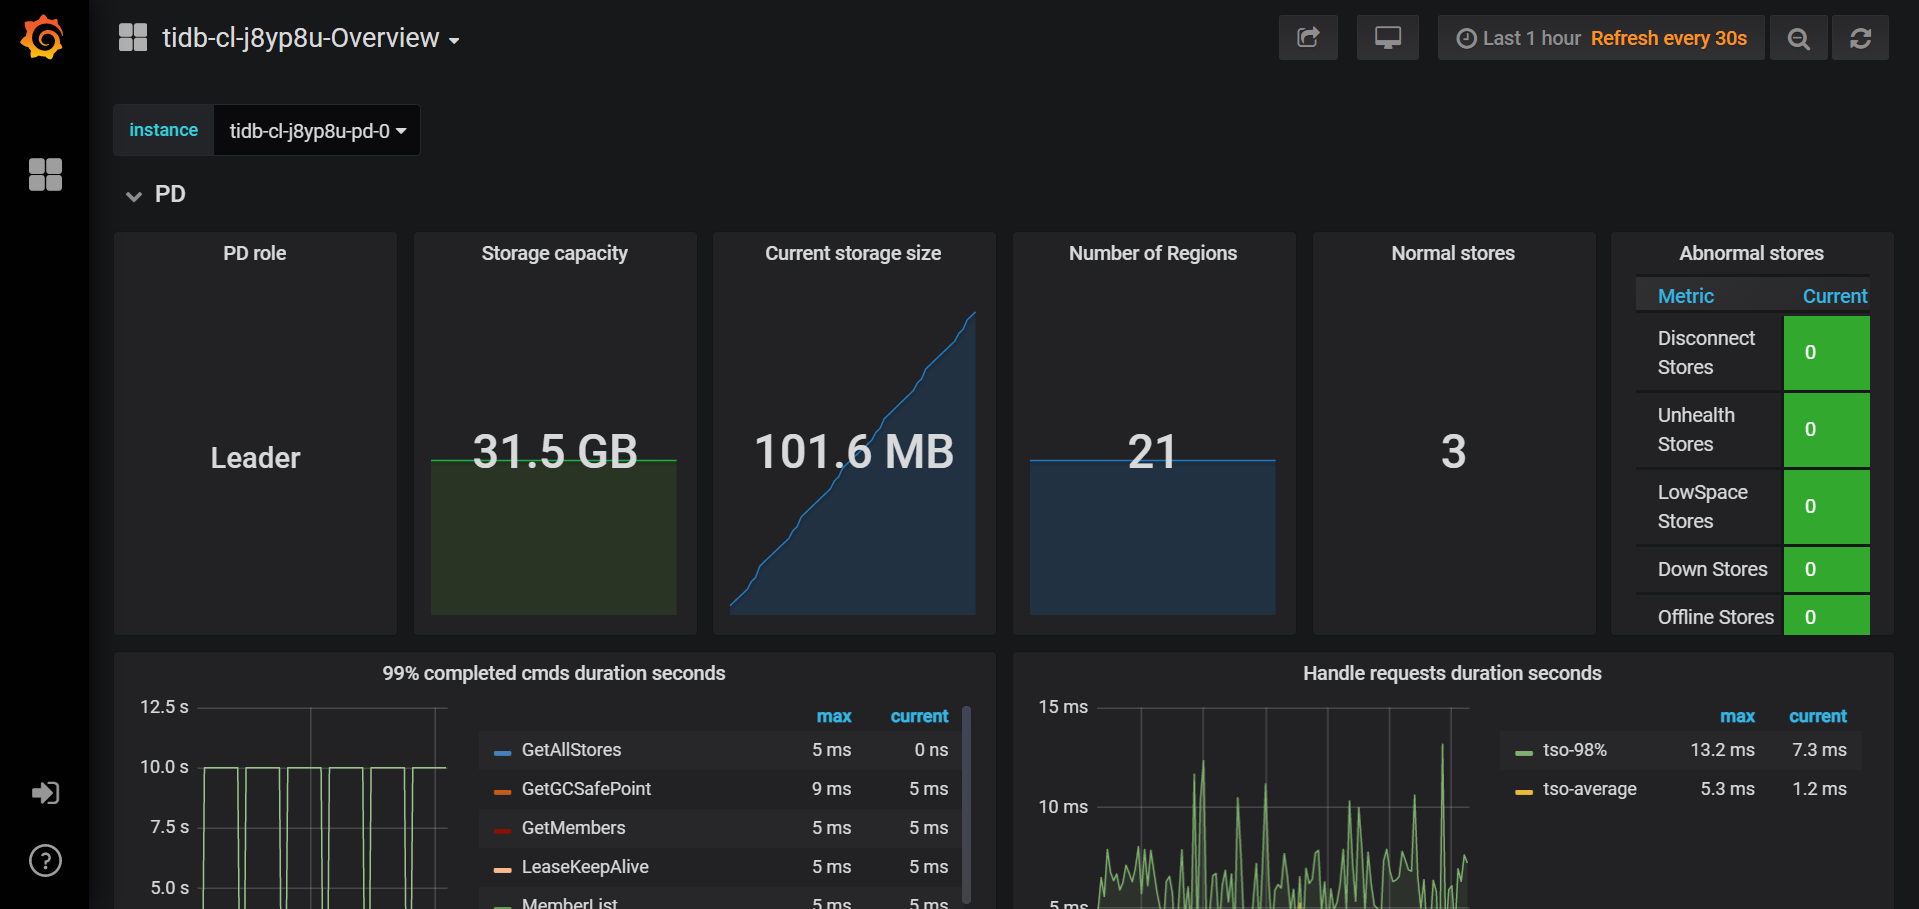
TiDB integrates Prometheus and Grafana to monitor performance of the database cluster. For example, you can access Grafana through
{$NodeIP}:{Nodeport}to view metrics.Note
You may need to open the port in your security groups and configure related port forwarding rules depending on where your Kubernetes cluster is deployed.


 Previous
