You are viewing documentation for KubeSphere version:v3.0.0
KubeSphere v3.0.0 documentation is no longer actively maintained. The version you are currently viewing is a static snapshot. For up-to-date documentation, see the latest version.
Event Query
Kubernetes events provide insight into what is happening inside a cluster, based on which KubeSphere adds longer historical query and aggregation capabilities, and also supports event query for tenant isolation.
This guide demonstrates how you can do multi-level, fine-grained event queries to track the status of your components.
Prerequisites
KubeSphere Events needs to be enabled.
Query Events
-
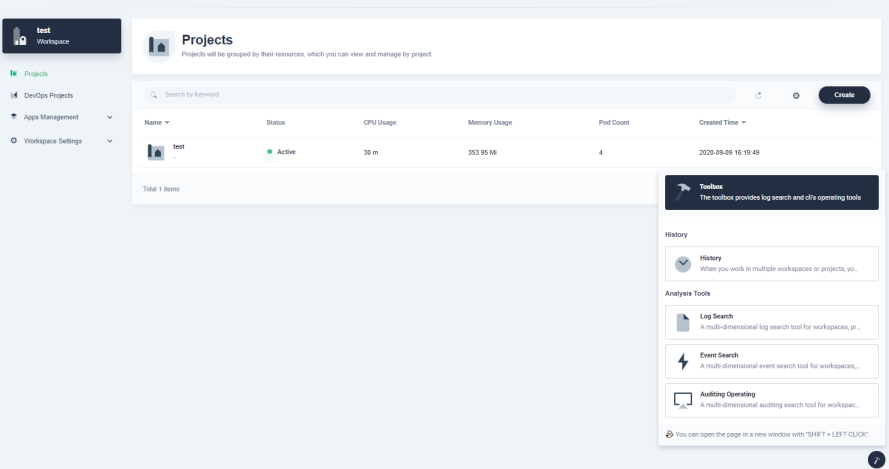
The event query function is available for all users. Log in to the console with any account, hover over the Toolbox in the lower right corner and select Event Search.

-
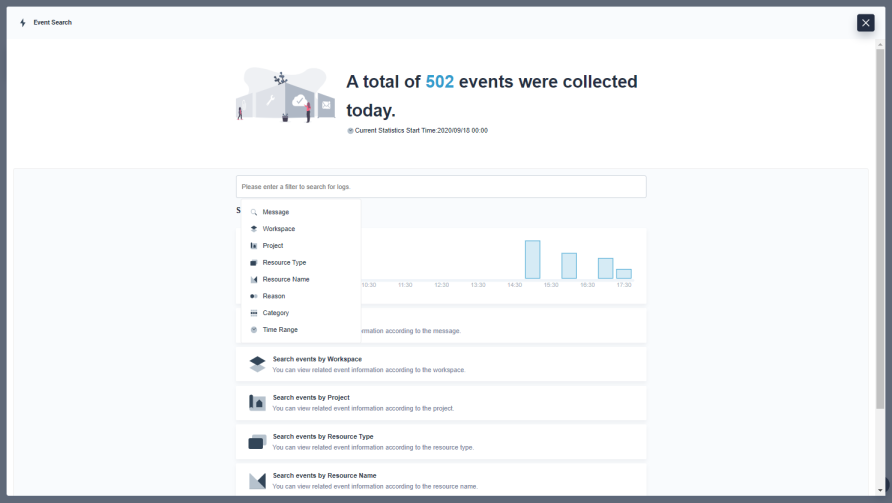
As shown in the pop-up window, you can see the number of events that the account has permission to view.

Note
-
KubeSphere supports event queries on each cluster separately if you have enabled the multi-cluster feature. You can switch the target cluster using the drop-down list next to the search bar.
-
Supported fields in the search bar:
- Workspace
- Project
- Resource Type
- Resource Name
- Reason
- Message
- Category
- Time Range
-
You can customize the query time range by selecting Time Range in the search bar. KubeSphere stores events for last seven days by default.
-
-
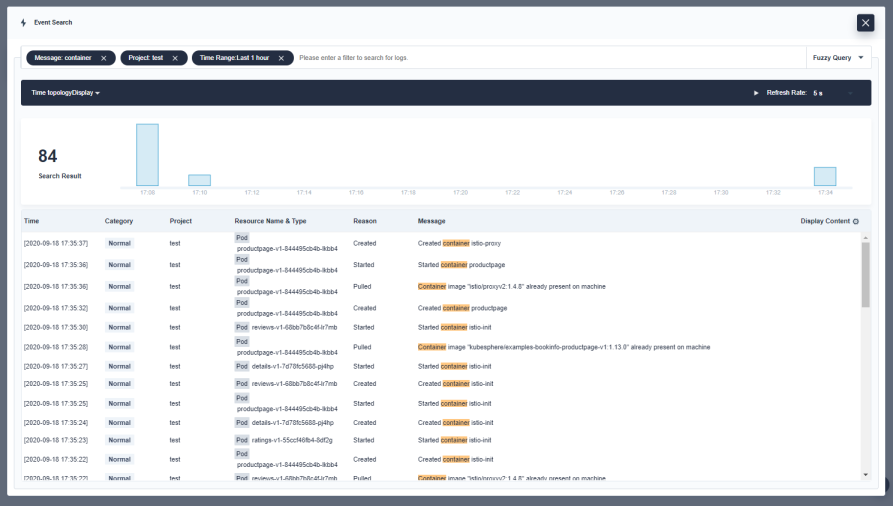
Here is an example to query events in the project
testwhose Message containscontainerwithin last 1 hour as shown in the following screenshot. It returns 84 rows of results with the corresponding time, project, and message all displayed.
-
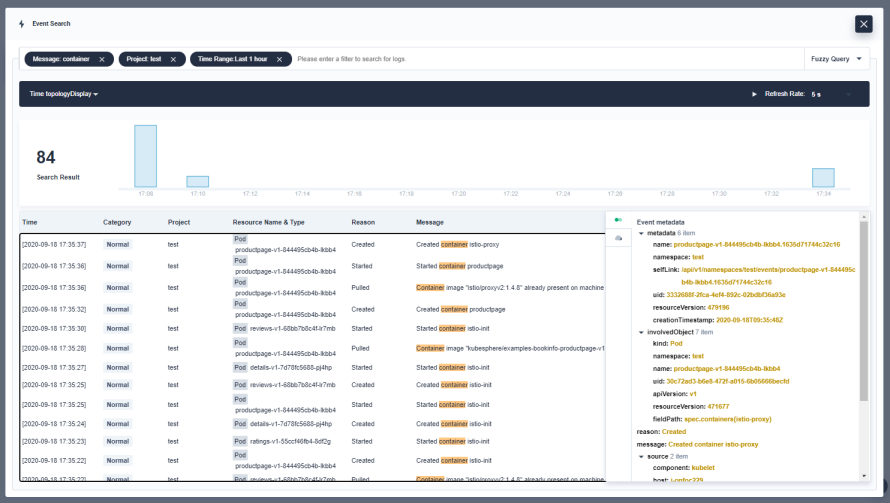
Click any one of the results from the list, and you can see raw information of it. It is convenient for developers in terms of debugging and analyzing.

Note
The event query interface supports dynamic refreshing every 5s, 10s or 15s.


 Previous
