


You are viewing documentation for KubeSphere version:v3.0.0
KubeSphere v3.0.0 documentation is no longer actively maintained. The version you are currently viewing is a static snapshot. For up-to-date documentation, see the latest version.


KubeSphere Auditing Logs
What are KubeSphere Auditing Logs
KubeSphere Auditing Log System provides a security-relevant chronological set of records documenting the sequence of activities related to individual users, managers, or other components of the system. Each request to KubeSphere generates an event that is then written to a webhook and processed according to a certain rule.
For more information, see Auditing Log Query.
Enable Auditing Logs before Installation
Installing on Linux
When you implement multi-node installation KubeSphere on Linux, you need to create a configuration file, which lists all KubeSphere components.
-
In the tutorial of Installing KubeSphere on Linux, you create a default file
config-sample.yaml. Modify the file by executing the following command:vi config-sample.yamlNote
If you adopt All-in-One Installation, you do not need to create aconfig-sample.yamlfile as you can create a cluster directly. Generally, the all-in-one mode is for users who are new to KubeSphere and look to get familiar with the system. If you want to enable Auditing in this mode (for example, for testing purposes), refer to the following section to see how Auditing can be installed after installation. -
In this file, navigate to
auditingand changefalsetotrueforenabled. Save the file after you finish.auditing: enabled: true # Change "false" to "true"Note
By default, KubeKey will install Elasticsearch internally if Auditing is enabled. For a production environment, it is highly recommended that you set the following values inconfig-sample.yamlif you want to enable Auditing, especiallyexternalElasticsearchUrlandexternalElasticsearchPort. Once you provide the following information before installation, KubeKey will integrate your external Elasticsearch directly instead of installing an internal one.es: # Storage backend for logging, tracing, events and auditing. elasticsearchMasterReplicas: 1 # total number of master nodes, it's not allowed to use even number elasticsearchDataReplicas: 1 # total number of data nodes elasticsearchMasterVolumeSize: 4Gi # Volume size of Elasticsearch master nodes elasticsearchDataVolumeSize: 20Gi # Volume size of Elasticsearch data nodes logMaxAge: 7 # Log retention time in built-in Elasticsearch, it is 7 days by default. elkPrefix: logstash # The string making up index names. The index name will be formatted as ks-<elk_prefix>-log externalElasticsearchUrl: # The URL of external Elasticsearch externalElasticsearchPort: # The port of external Elasticsearch -
Create a cluster using the configuration file:
./kk create cluster -f config-sample.yaml
Installing on Kubernetes
The process of installing KubeSphere on Kubernetes is same as stated in the tutorial of Installing KubeSphere on Kubernetes except the optional component Auditing needs to be enabled first in the cluster-configuration.yaml file.
-
Download the file cluster-configuration.yaml and open it for editing.
vi cluster-configuration.yaml -
In this local
cluster-configuration.yamlfile, navigate toauditingand enable Auditing by changingfalsetotrueforenabled. Save the file after you finish.auditing: enabled: true # Change "false" to "true"Note
By default, ks-installer will install Elasticsearch internally if Auditing is enabled. For a production environment, it is highly recommended that you set the following values incluster-configuration.yamlif you want to enable Auditing, especiallyexternalElasticsearchUrlandexternalElasticsearchPort. Once you provide the following information before installation, ks-installer will integrate your external Elasticsearch directly instead of installing an internal one.es: # Storage backend for logging, tracing, events and auditing. elasticsearchMasterReplicas: 1 # total number of master nodes, it's not allowed to use even number elasticsearchDataReplicas: 1 # total number of data nodes elasticsearchMasterVolumeSize: 4Gi # Volume size of Elasticsearch master nodes elasticsearchDataVolumeSize: 20Gi # Volume size of Elasticsearch data nodes logMaxAge: 7 # Log retention time in built-in Elasticsearch, it is 7 days by default. elkPrefix: logstash # The string making up index names. The index name will be formatted as ks-<elk_prefix>-log externalElasticsearchUrl: # The URL of external Elasticsearch externalElasticsearchPort: # The port of external Elasticsearch -
Execute the following commands to start installation:
kubectl apply -f https://github.com/kubesphere/ks-installer/releases/download/v3.0.0/kubesphere-installer.yaml

kubectl apply -f cluster-configuration.yaml
Enable Auditing Logs after Installation
-
Log in to the console as
admin. Click Platform in the top-left corner and select Clusters Management.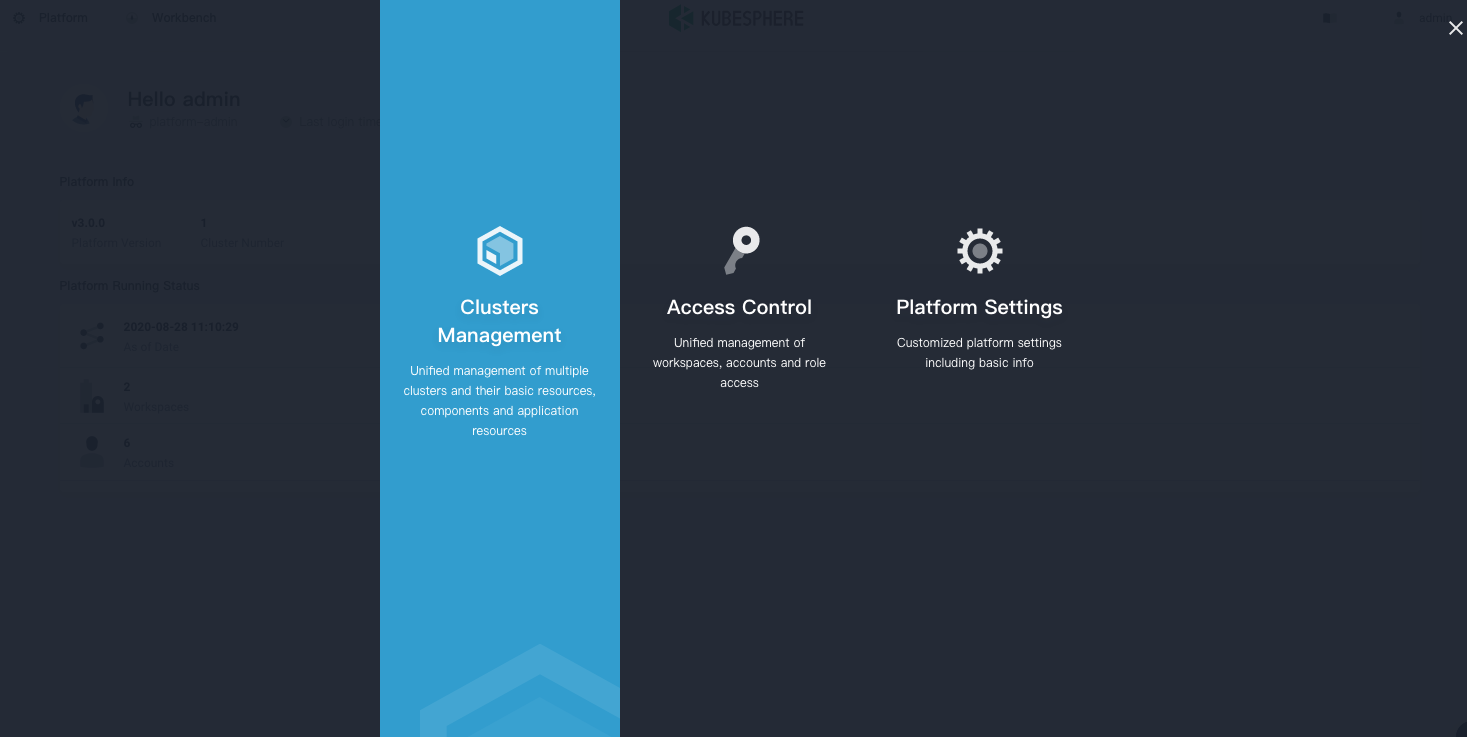
-
Click CRDs and enter
clusterconfigurationin the search bar. Click the result to view its detail page.Info
A Custom Resource Definition (CRD) allows users to create a new type of resources without adding another API server. They can use these resources like any other native Kubernetes objects. -
In Resource List, click the three dots on the right of
ks-installerand select Edit YAML.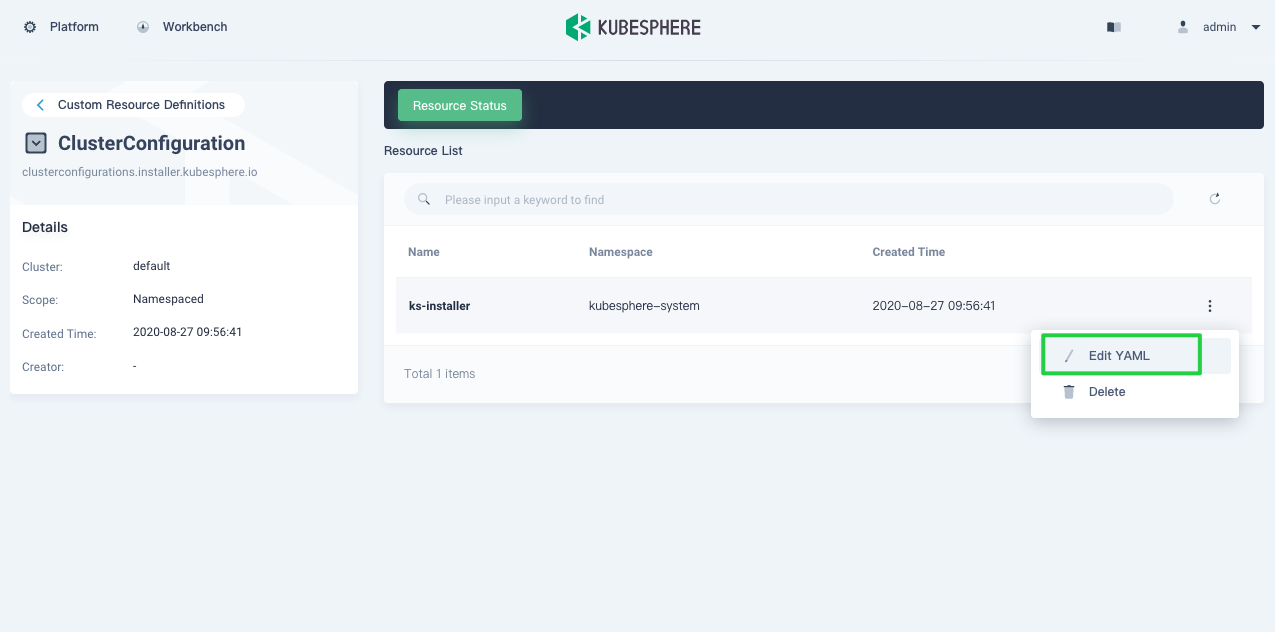
-
In this yaml file, navigate to
auditingand changefalsetotrueforenabled. After you finish, click Update in the bottom-right corner to save the configuration.auditing: enabled: true # Change "false" to "true"Note
By default, Elasticsearch will be installed internally if Auditing is enabled. For a production environment, it is highly recommended that you set the following values in this yaml file if you want to enable Auditing, especiallyexternalElasticsearchUrlandexternalElasticsearchPort. Once you provide the following information, KubeSphere will integrate your external Elasticsearch directly instead of installing an internal one.es: # Storage backend for logging, tracing, events and auditing. elasticsearchMasterReplicas: 1 # total number of master nodes, it's not allowed to use even number elasticsearchDataReplicas: 1 # total number of data nodes elasticsearchMasterVolumeSize: 4Gi # Volume size of Elasticsearch master nodes elasticsearchDataVolumeSize: 20Gi # Volume size of Elasticsearch data nodes logMaxAge: 7 # Log retention time in built-in Elasticsearch, it is 7 days by default. elkPrefix: logstash # The string making up index names. The index name will be formatted as ks-<elk_prefix>-log externalElasticsearchUrl: # The URL of external Elasticsearch externalElasticsearchPort: # The port of external Elasticsearch -
You can use the web kubectl to check the installation process by executing the following command:
kubectl logs -n kubesphere-system $(kubectl get pod -n kubesphere-system -l app=ks-install -o jsonpath='{.items[0].metadata.name}') -fTip
You can find the web kubectl tool by clicking the hammer icon in the bottom-right corner of the console.
Verify the Installation of the Component
If you enable both Logging and Auditing, you can check the status of Auditing in Logging in Components. You may see an image as follows:
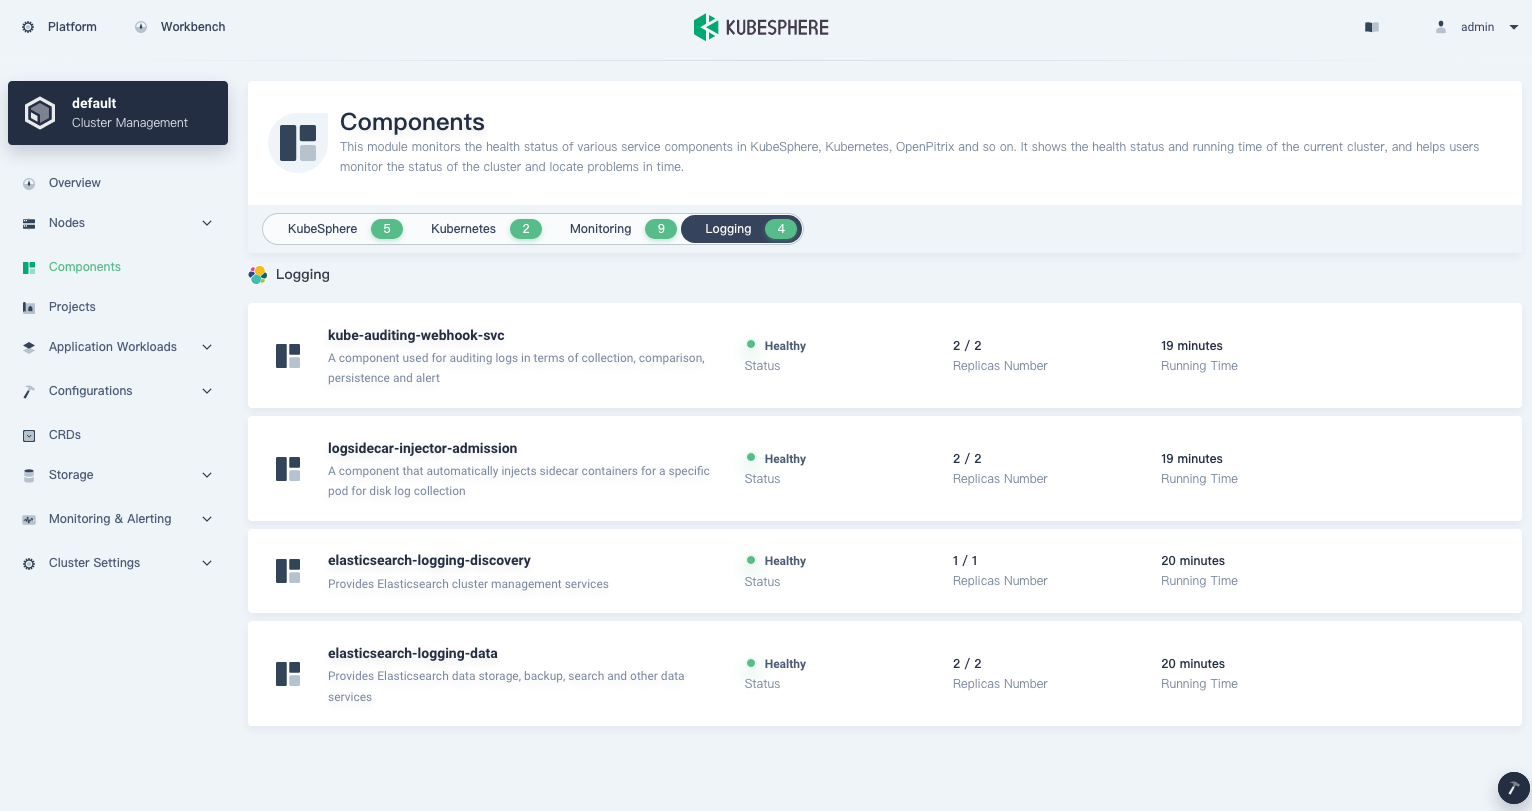
If you only enable Auditing without Logging installed, you cannot see the image above as the button Logging will not display.
Execute the following command to check the status of Pods:
kubectl get pod -n kubesphere-logging-system
The output may look as follows if the component runs successfully:
NAME                                                              READY   STATUS      RESTARTS   AGE
elasticsearch-logging-curator-elasticsearch-curator-159872n9g9g   0/1     Completed   0          2d10h
elasticsearch-logging-curator-elasticsearch-curator-159880tzb7x   0/1     Completed   0          34h
elasticsearch-logging-curator-elasticsearch-curator-1598898q8w7   0/1     Completed   0          10h
elasticsearch-logging-data-0                                      1/1     Running     1          2d20h
elasticsearch-logging-data-1                                      1/1     Running     1          2d20h
elasticsearch-logging-discovery-0                                 1/1     Running     1          2d20h
fluent-bit-6v5fs                                                  1/1     Running     1          2d20h
fluentbit-operator-5bf7687b88-44mhq                               1/1     Running     1          2d20h
kube-auditing-operator-7574bd6f96-p4jvv                           1/1     Running     1          2d20h
kube-auditing-webhook-deploy-6dfb46bb6c-hkhmx                     1/1     Running     1          2d20h
kube-auditing-webhook-deploy-6dfb46bb6c-jp77q                     1/1     Running     1          2d20h
 Previous

What’s on this Page