
You are viewing documentation for KubeSphere version:v3.0.0
KubeSphere v3.0.0 documentation is no longer actively maintained. The version you are currently viewing is a static snapshot. For up-to-date documentation, see the latest version.
Deploy Apps from App Templates
When you deploy an app, you can select the app from the App Store which contains built-in apps of KubeSphere and apps uploaded as Helm charts. Alternatively, you can use apps from private app repositories added to KubeSphere to provide app templates.
This tutorial demonstrates how to quickly deploy Grafana using the app template from a private repository, which is based on QingStor object storage.
Prerequisites
- You have enabled OpenPitrix (App Store).
- You have completed the tutorial of Create Workspaces, Projects, Accounts and Roles. Namely, you must have a workspace, a project and two user accounts (
ws-adminandproject-regular).ws-adminmust be granted the role ofworkspace-adminin the workspace andproject-regularmust be granted the role ofoperatorin the project.
Hands-on Lab
Step 1: Add an app repository
-
Log in to the web console of KubeSphere as
ws-admin. In your workspace, go to App Repos under Apps Management, and then click Add Repo.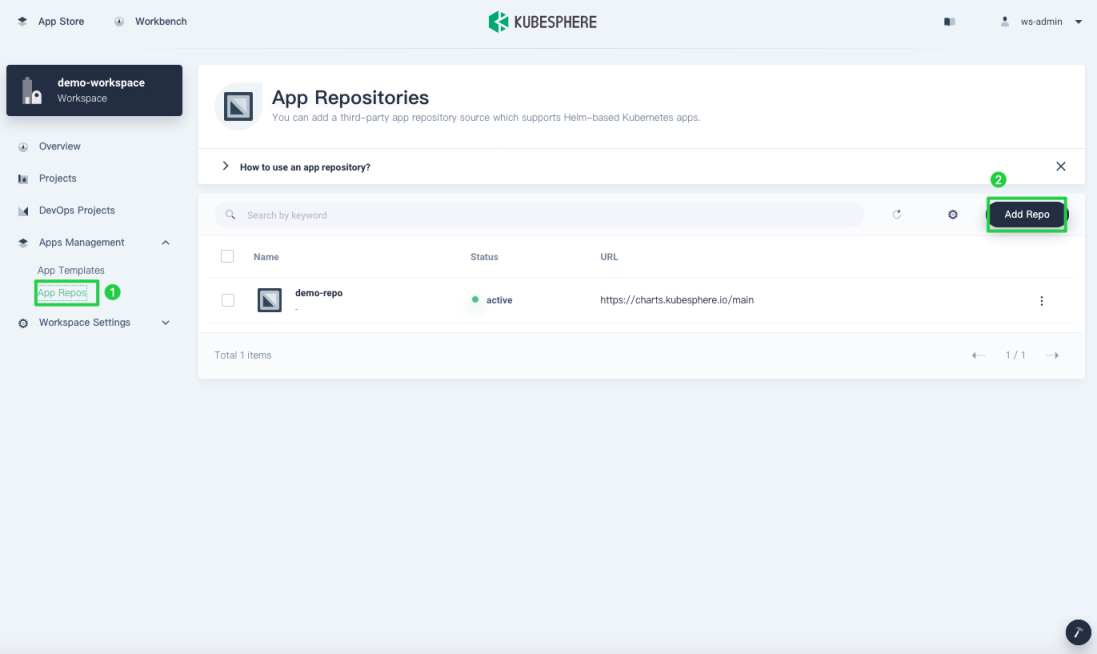
-
In the dialog that appears, enter
test-repofor the app repository name andhttps://helm-chart-repo.pek3a.qingstor.com/kubernetes-charts/for the repository URL. Click Validate to verify the URL and click OK to continue.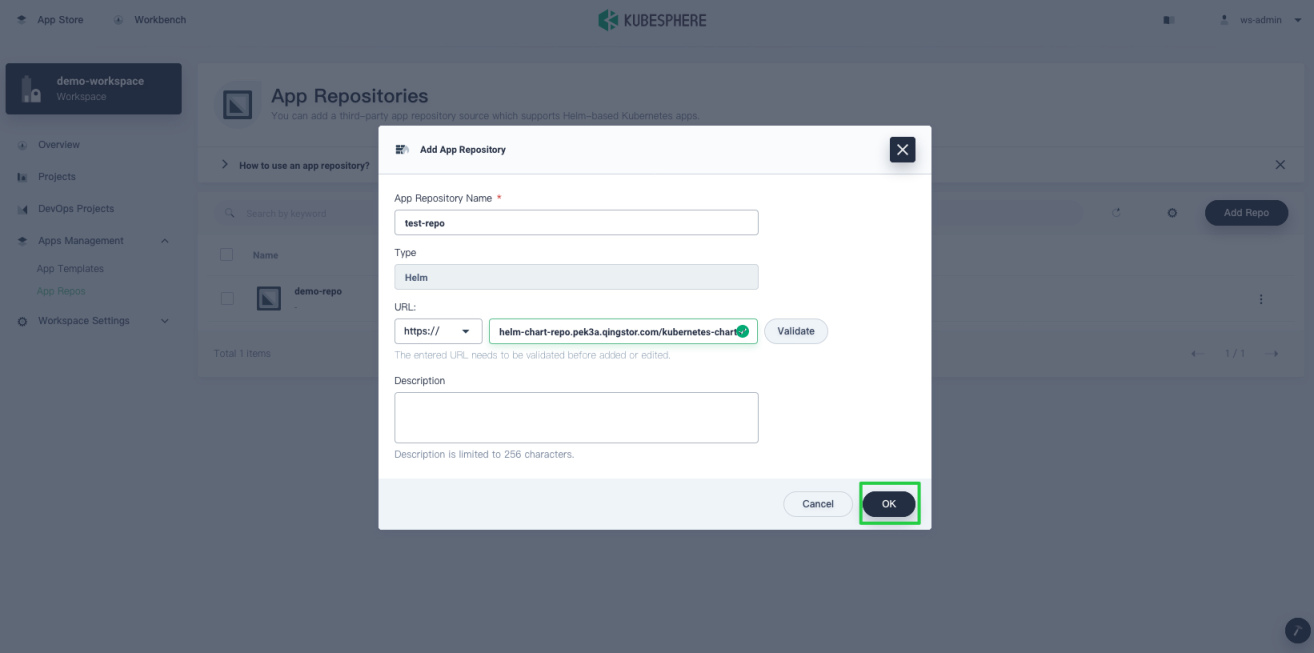
-
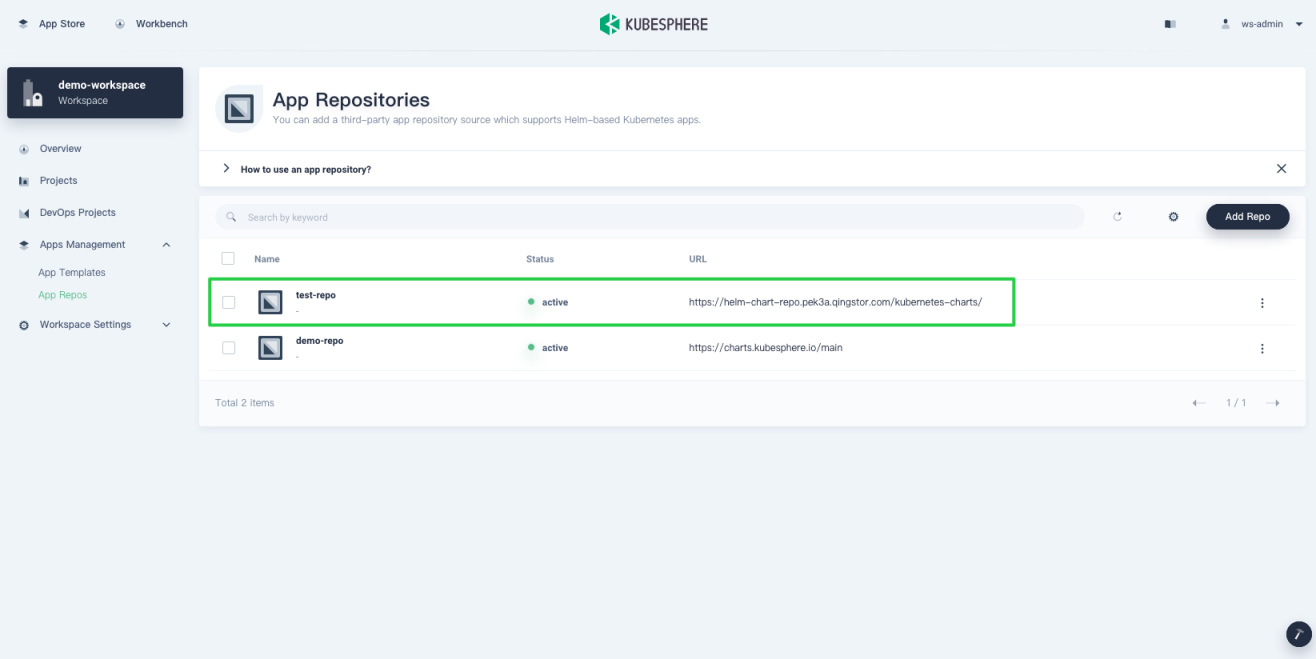
Your repository displays in the list after successfully imported to KubeSphere.
Note
For more information about dashboard properties as you add a private repository, see Import Helm Repository.
Step 2: Deploy Grafana from app templates
-
Log out of KubeSphere and log back in as
project-regular. In your project, choose Applications under Application Workloads and click Deploy New Application.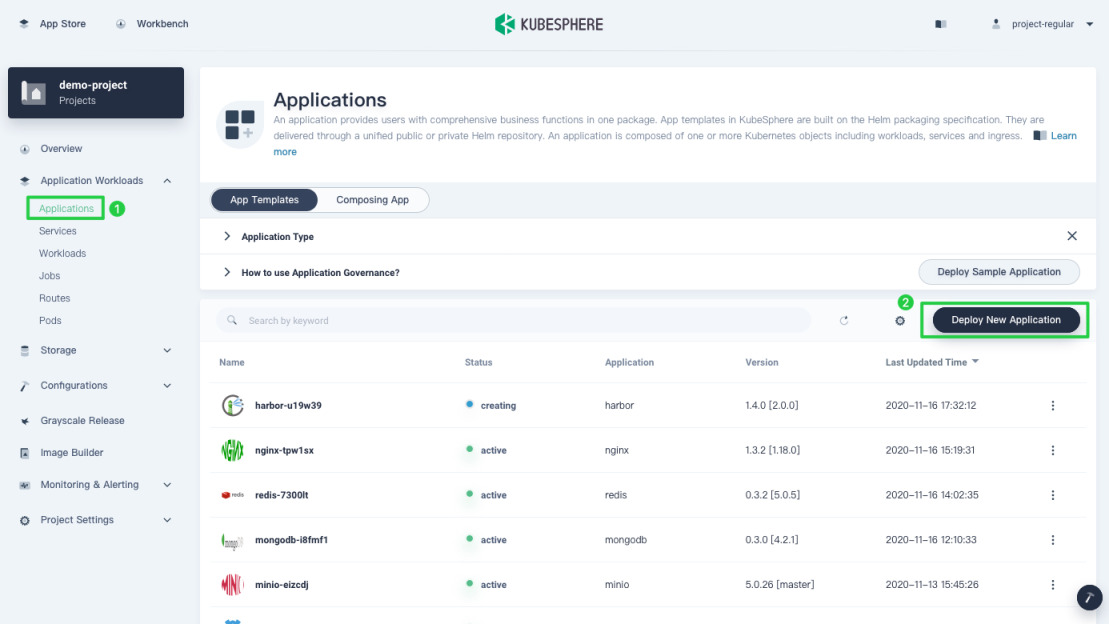
-
Select From App Templates from the pop-up dialog.
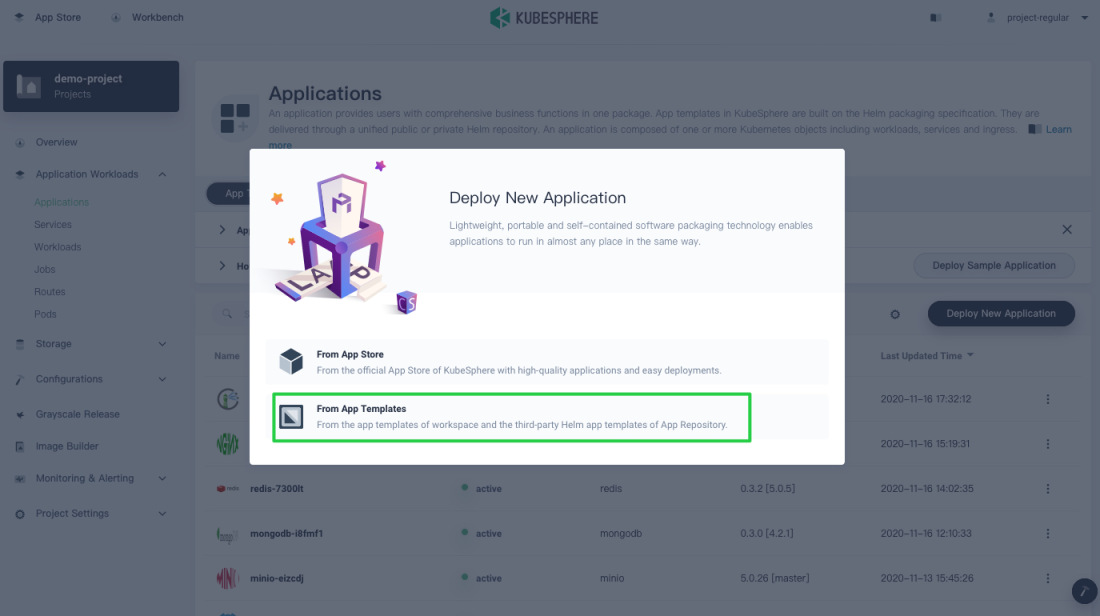
From App Store: Choose built-in apps and apps uploaded individually as Helm charts.
From App Templates: Choose apps from private app repositories and the workspace app pool.
-
Select
test-repofrom the drop-down list, which is the private app repository just uploaded.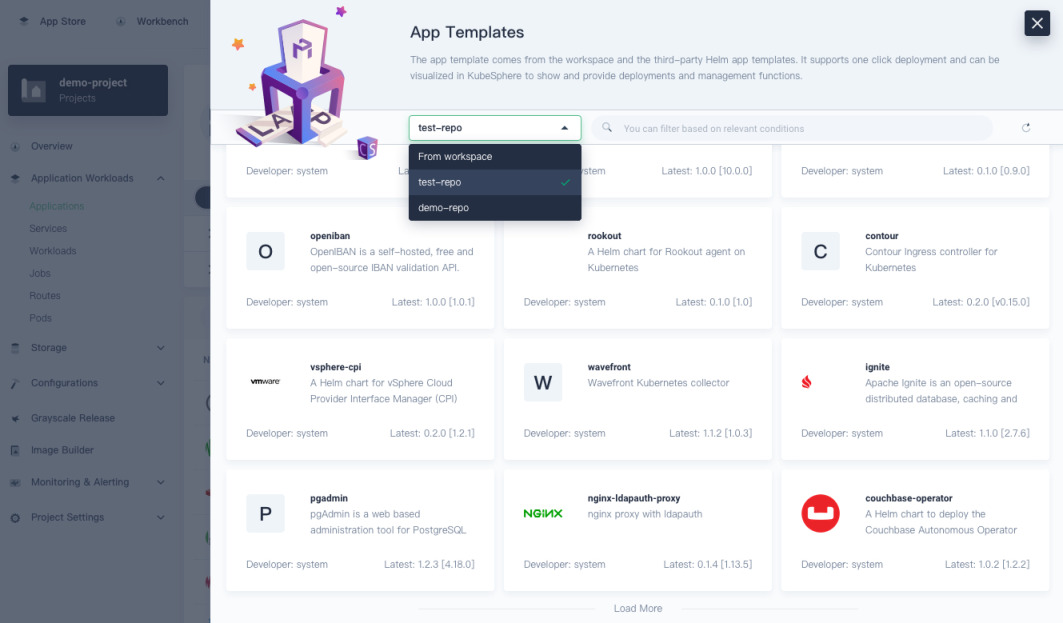
Note
The option From workspace in the list represents the workspace app pool, which contains apps uploaded as Helm charts. They are also part of app templates. -
Input
Grafanain the search bar to find the app, and then click it to deploy it.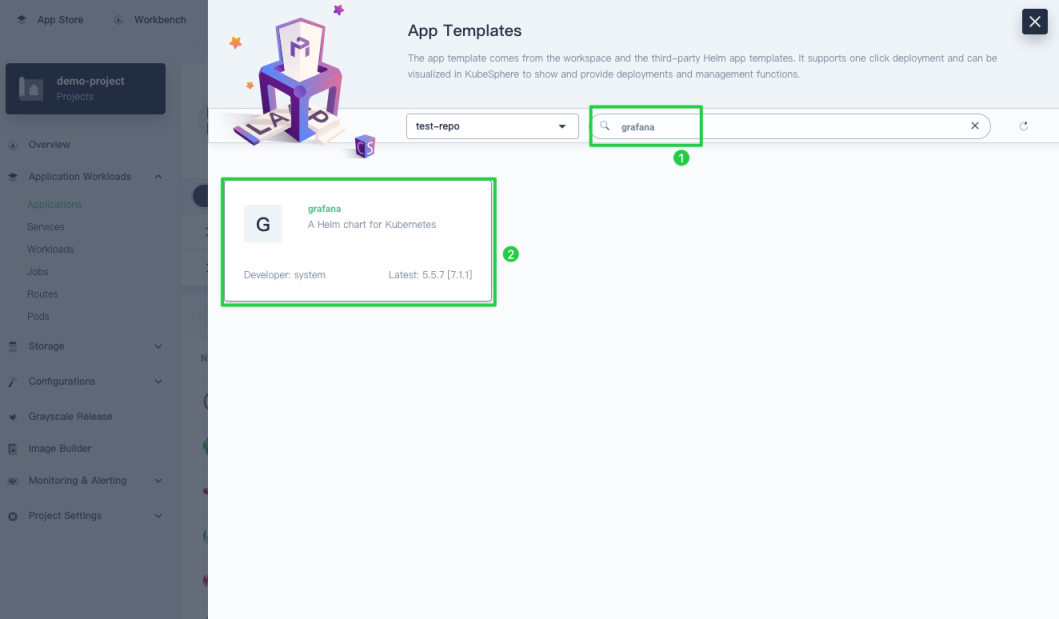
Note
The app repository used in this tutorial is synchronized from the Google Helm repository. Some apps in it may not be deployed successfully as their Helm charts are maintained by different organizations. -
You can view its app information and configuration files. Under Versions, select a version number from the list and click Deploy.
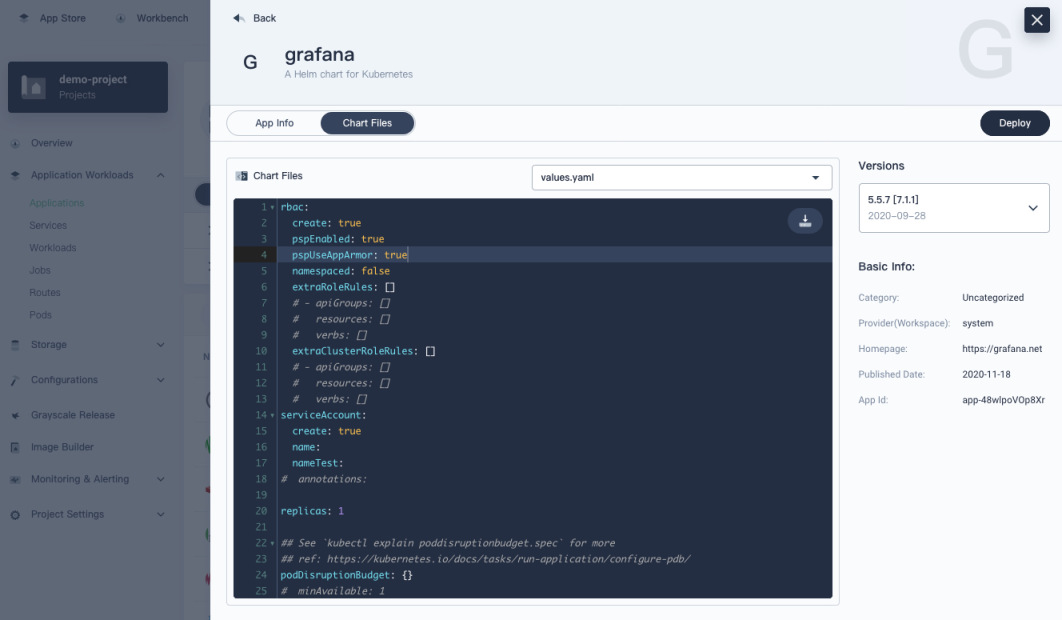
-
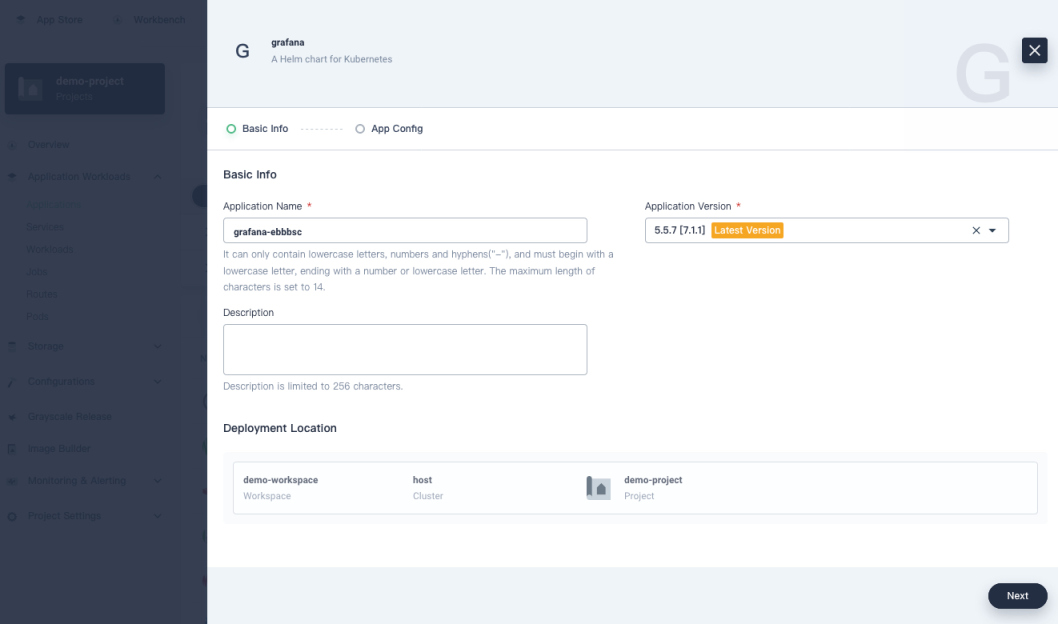
Set an app name and confirm the version and deployment location. Click Next to continue.
-
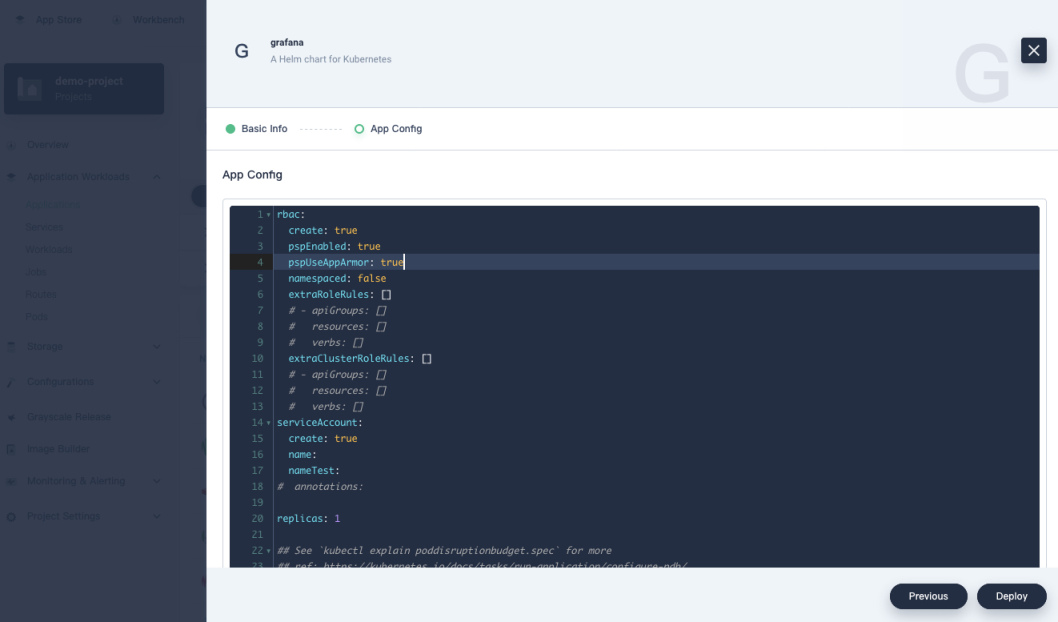
In App Config, you can manually edit the manifest file or click Deploy directly.
-
Wait for Grafana to be up and running.
Step 3: Expose the Grafana Service
To access Grafana outside the cluster, you need to expose the app through a NodePort first.
-
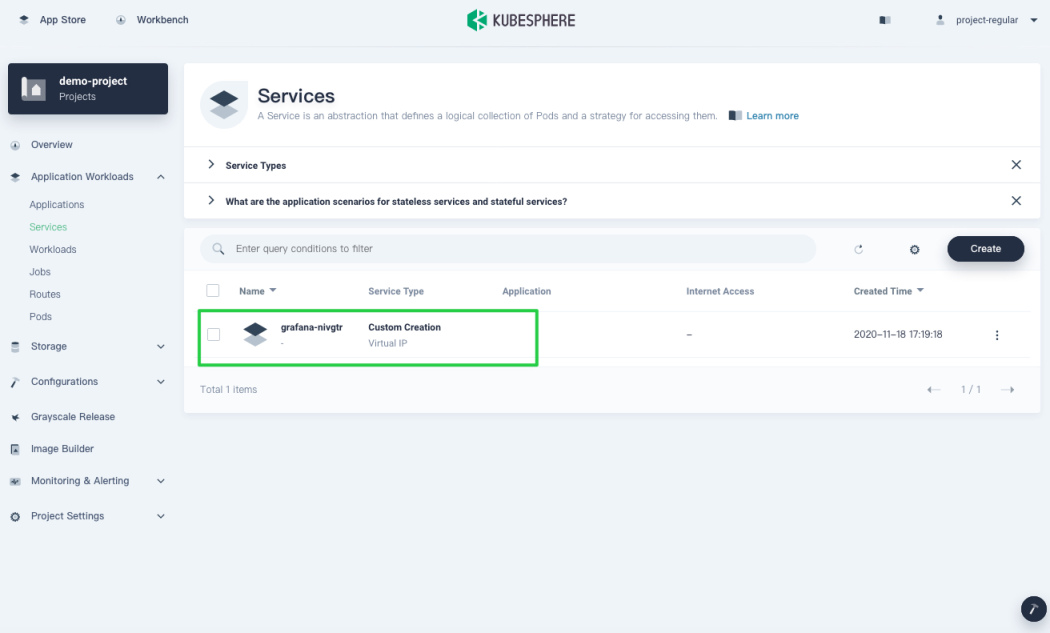
Go to Services and click the service name of Grafana.
-
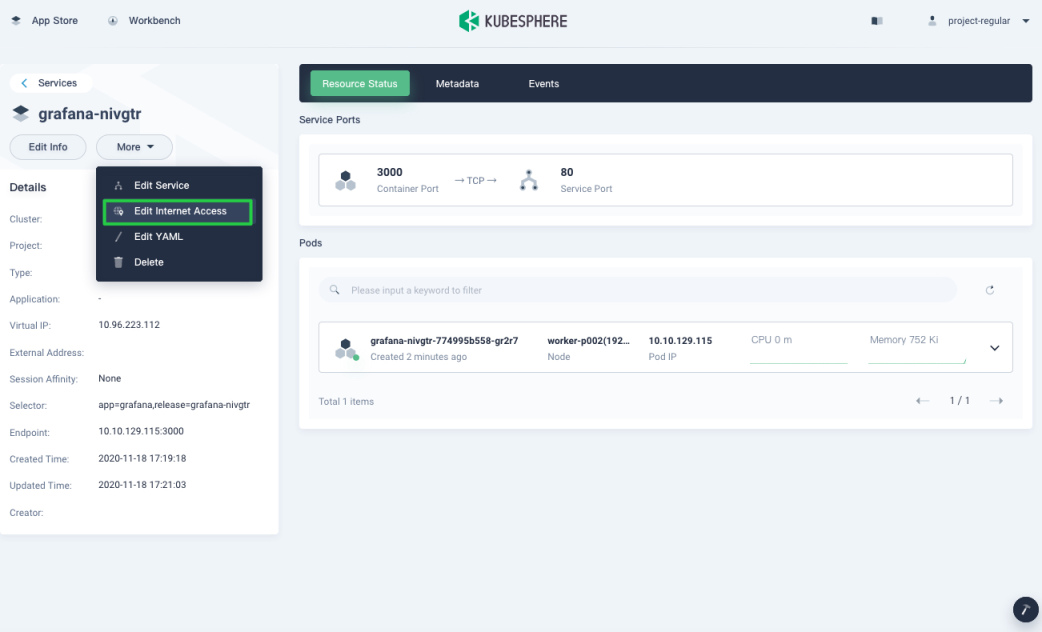
Click More and select Edit Internet Access from the drop-down menu.
-
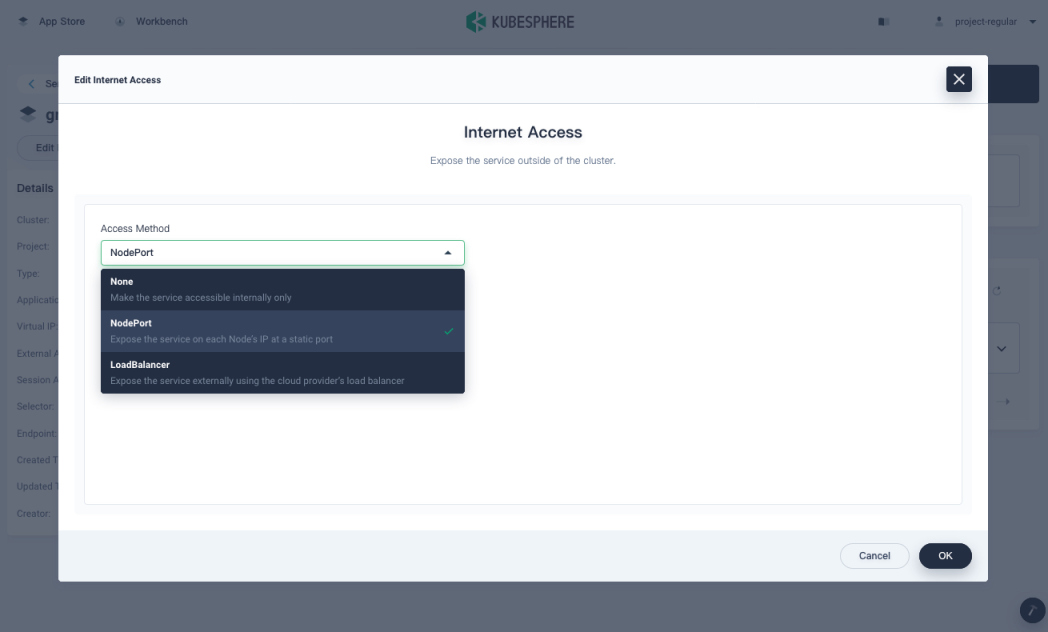
Select NodePort for Access Method and click OK. For more information, see Project Gateway.
-
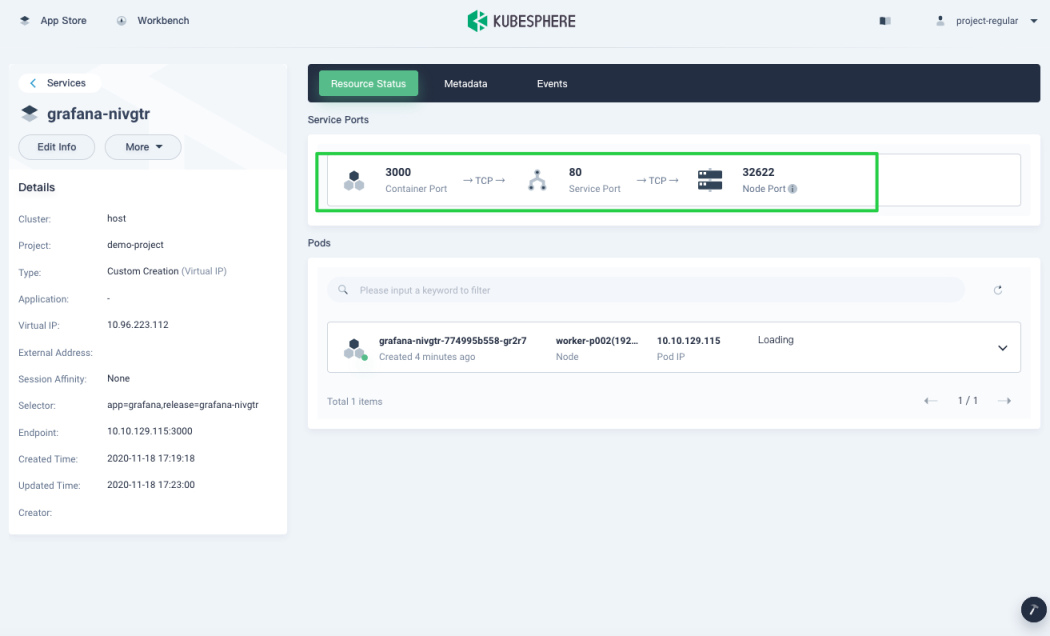
Under Service Ports, you can see the port is exposed.
Step 4: Access Grafana
-
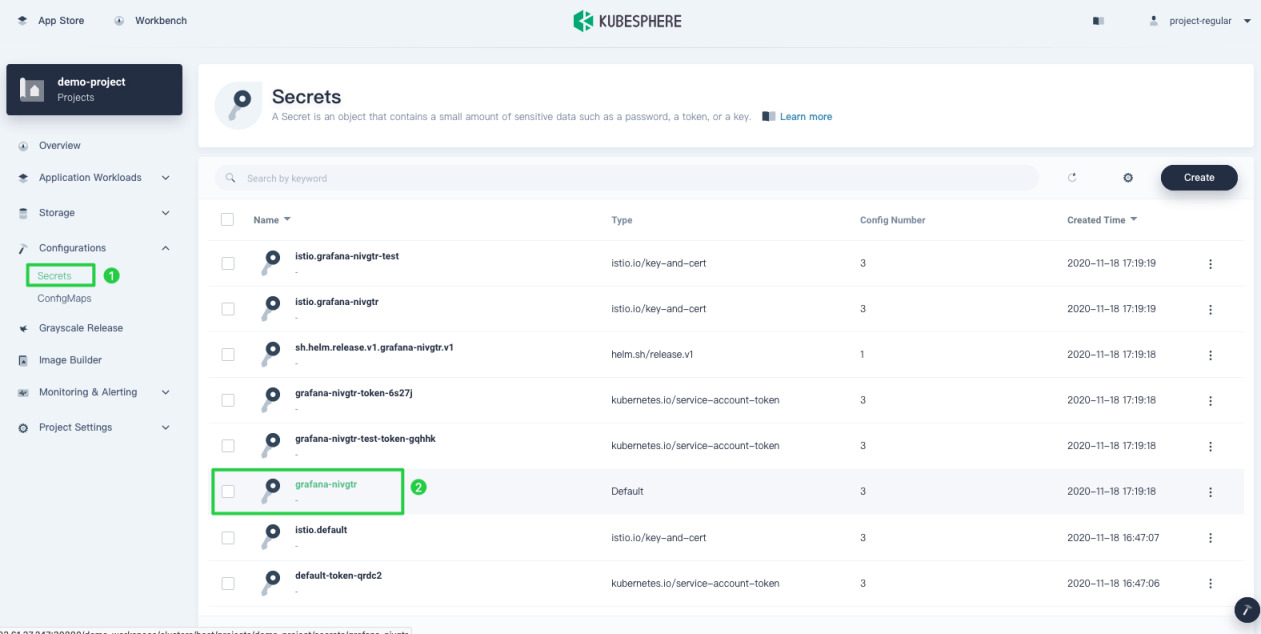
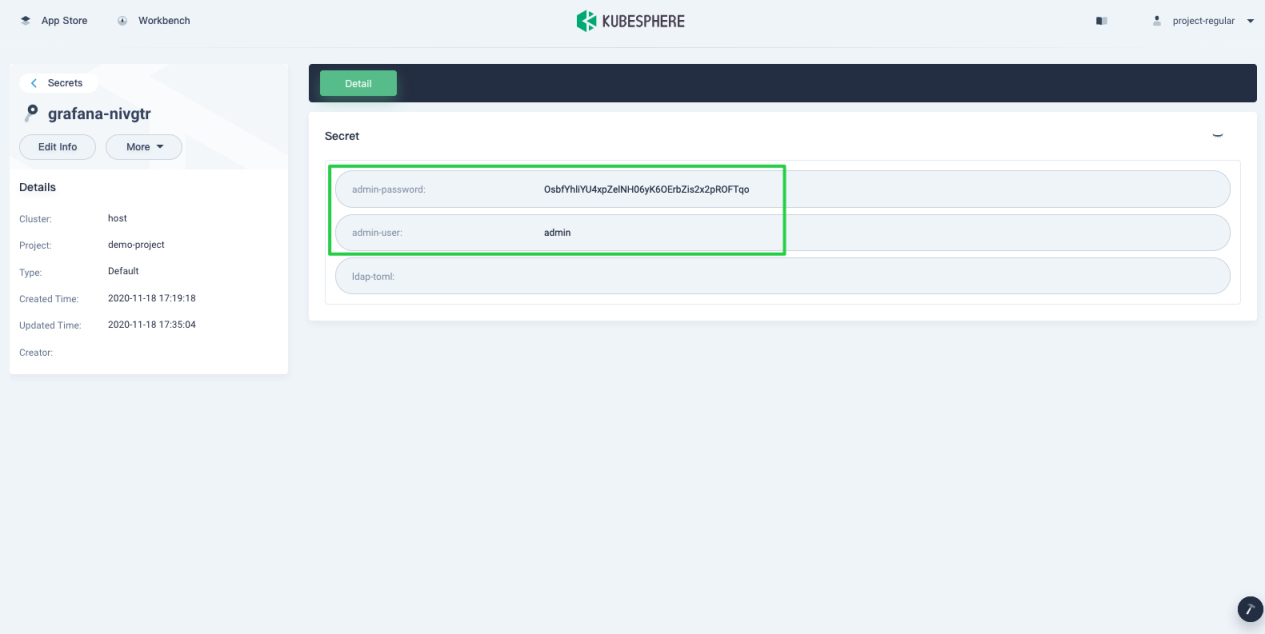
To access the Grafana dashboard, you need the username and password. Navigate to Secrets and click the item that has the same name as the app name.
-
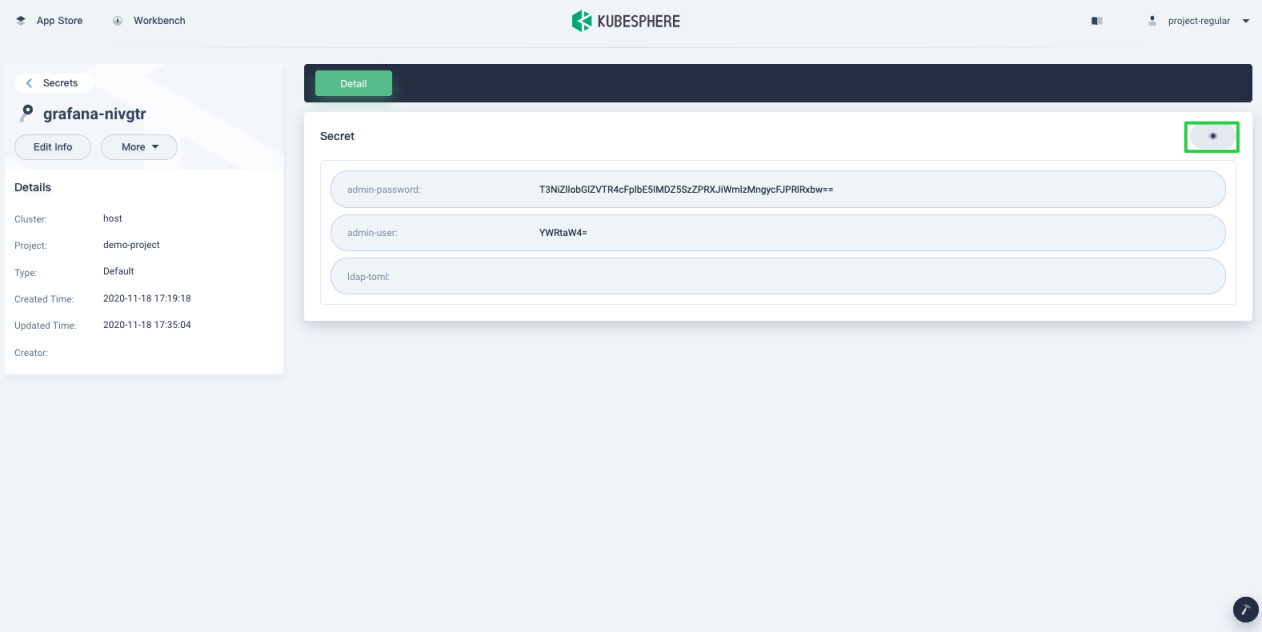
On the detail page, click the eye icon first and you can see the username and password.
-
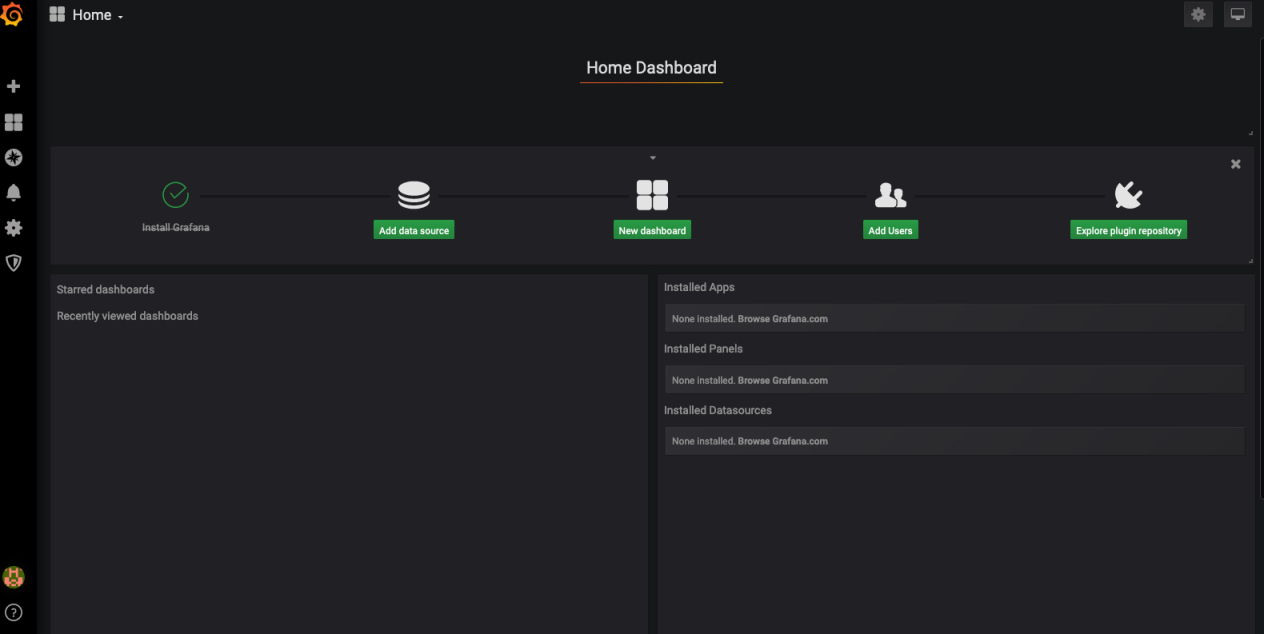
Access Grafana through
${Node IP}:${NODEPORT}.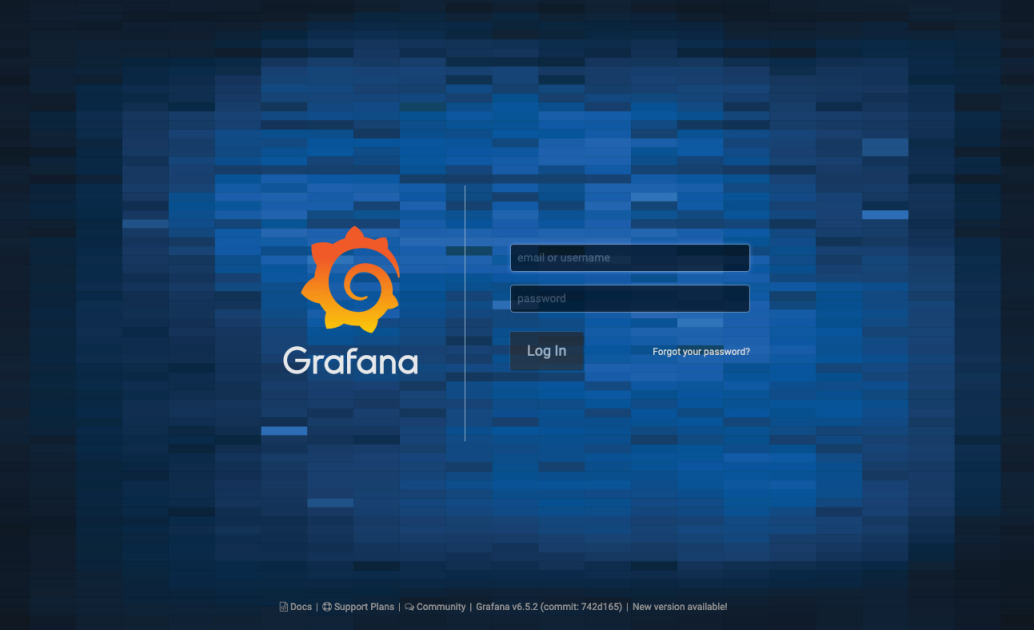
Note
You may need to open the port in your security groups and configure related port forwarding rules depending on your where your Kubernetes cluster is deployed.


 Previous
