


You are viewing documentation for KubeSphere version:v3.0.0
KubeSphere v3.0.0 documentation is no longer actively maintained. The version you are currently viewing is a static snapshot. For up-to-date documentation, see the latest version.


Monitoring Dashboard — Overview
This section introduces monitoring dashboard features. You will learn how to visualize metric data in KubeSphere for your custom apps. If you do not know how to integrate your app metrics into the KubeSphere monitoring system, read Introduction first.
Create a Monitoring Dashboard
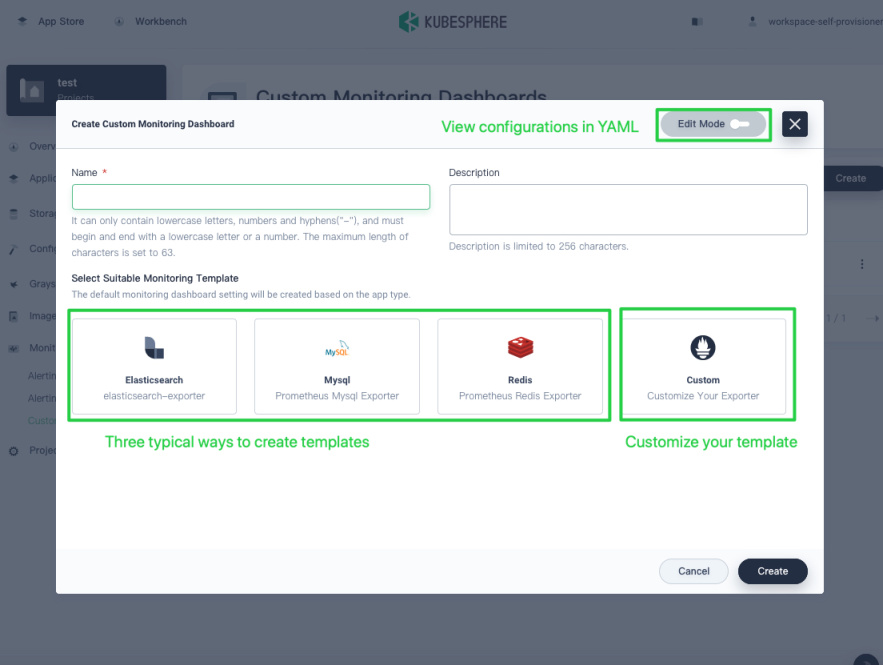
To create new dashboards for your app metrics, navigate to Custom Monitoring under Monitoring & Alerting in a project. There are three ways to create monitoring dashboards: built-in templates, blank templates for customization and YAML files.
There are three available built-in templates for MySQL, Elasticsearch, and Redis respectively. These templates are for demonstration purposes and are updated with KubeSphere releases. Besides, you can choose to customize monitoring dashboards.
A KubeSphere custom monitoring dashboard can be seen as simply a YAML configuration file. The data model is heavily inspired by Grafana, an open-source tool for monitoring and observability. Please find KubeSphere monitoring dashboard data model design in kubesphere/monitoring-dashboard. The configuration file is portable and sharable. You are welcome to contribute dashboard templates to the KubeSphere community via Monitoring Dashboards Gallery.
From a built-in template
To help you quickly get started, KubeSphere provides built-in templates for MySQL, Elasticsearch, and Redis. If you want to create dashboards from built-in templates, select a template and then click Create.
From a blank template
To start with a blank template, click Create.
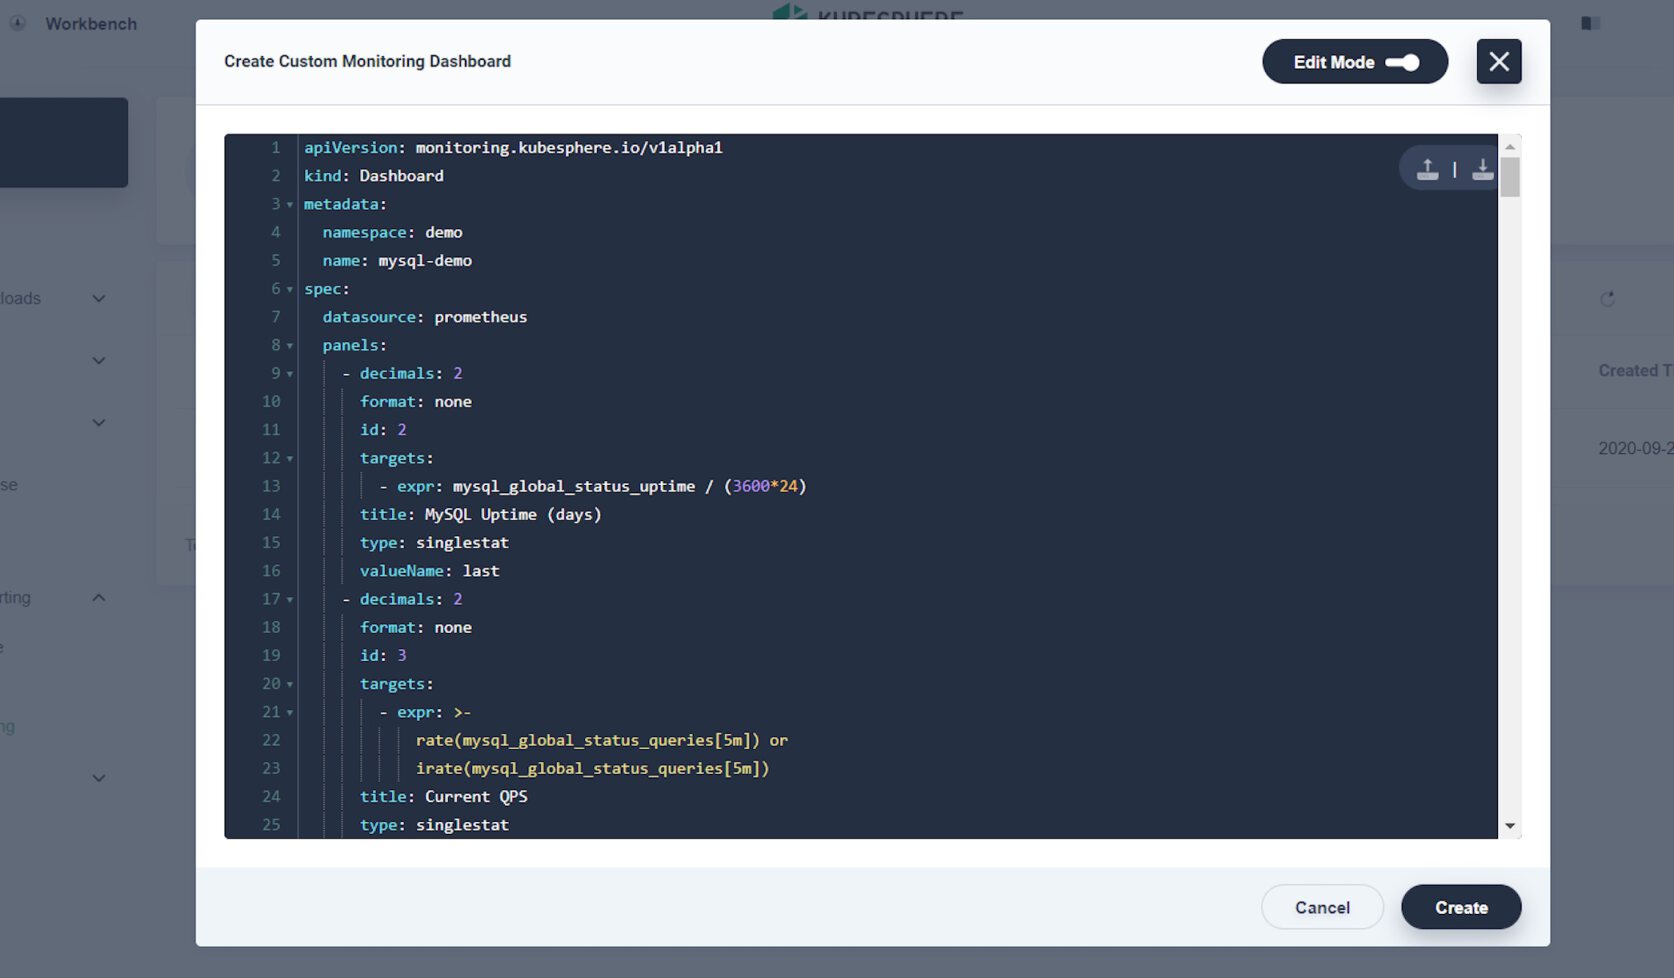
From a YAML file
Toggle to Edit Mode in the top right corner then paste your dashboard YAML file.
Dashboard Layout
The monitoring dashboard is composed of four parts. Global settings are on the top of the page. The left-most column is for text-based charts showing the current value of metrics. The middle column contains chart collections for visualizing metrics over a specific period. The right-most column presents detailed information in charts.
Top bar
On the top bar, you can configure the following settings: title, theme, time range, and refresh interval.
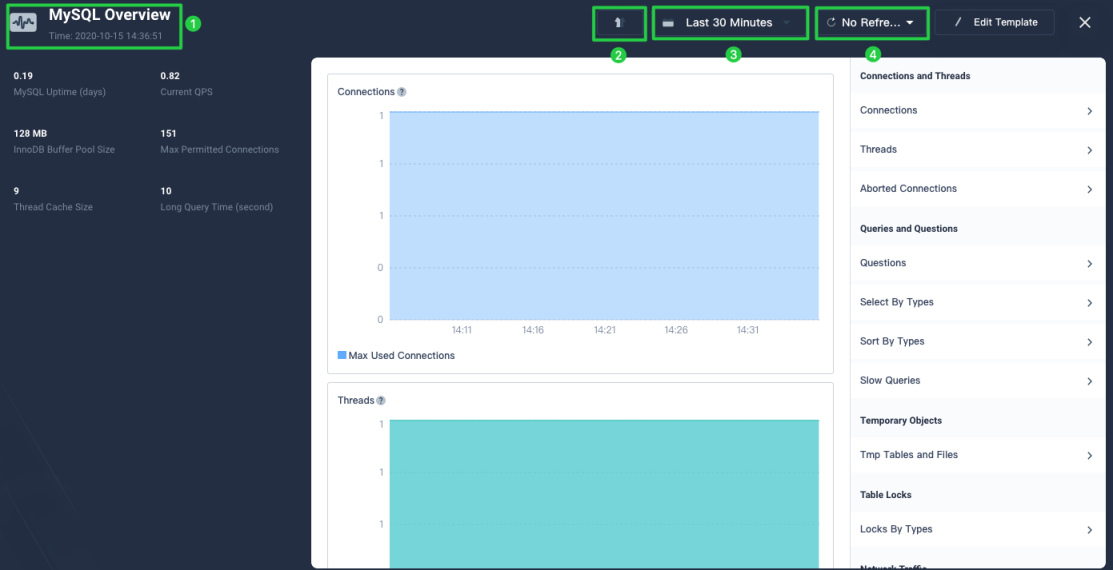
Text chart column
You can add new text charts in the left-most column.
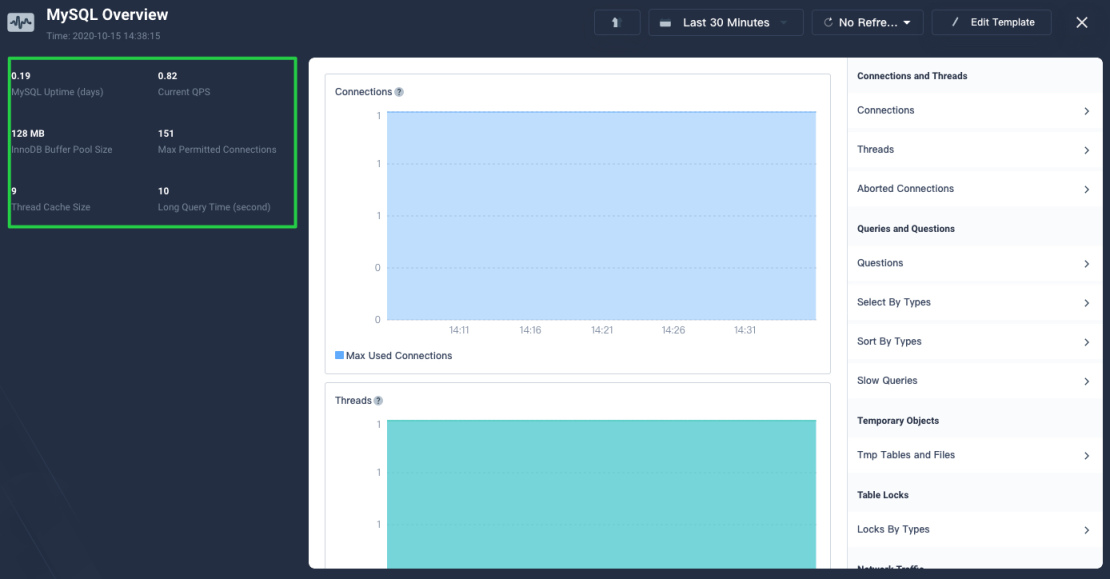
Chart display column
You can view charts in the middle column.
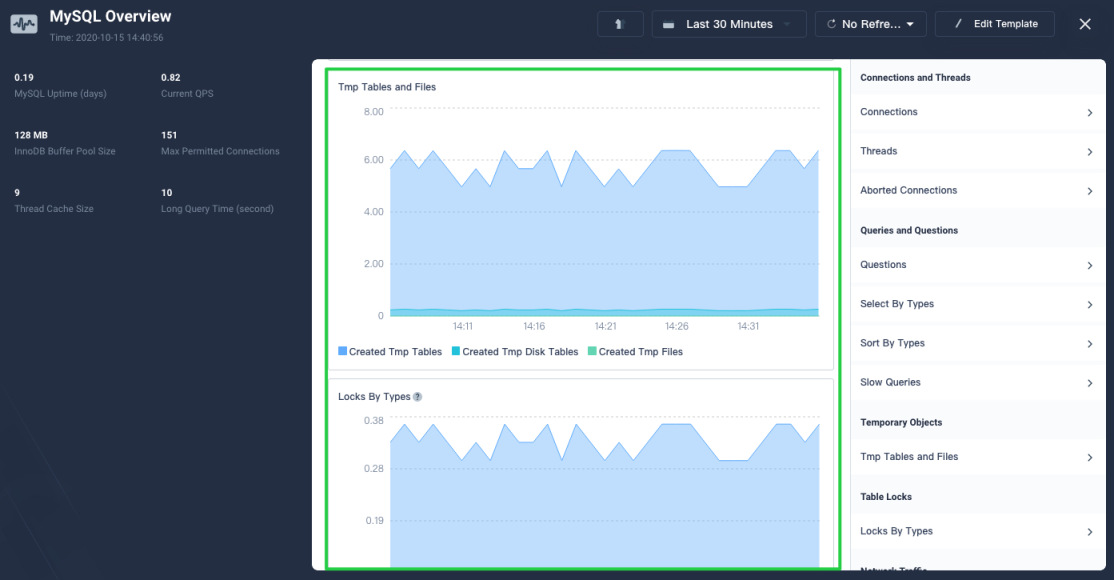
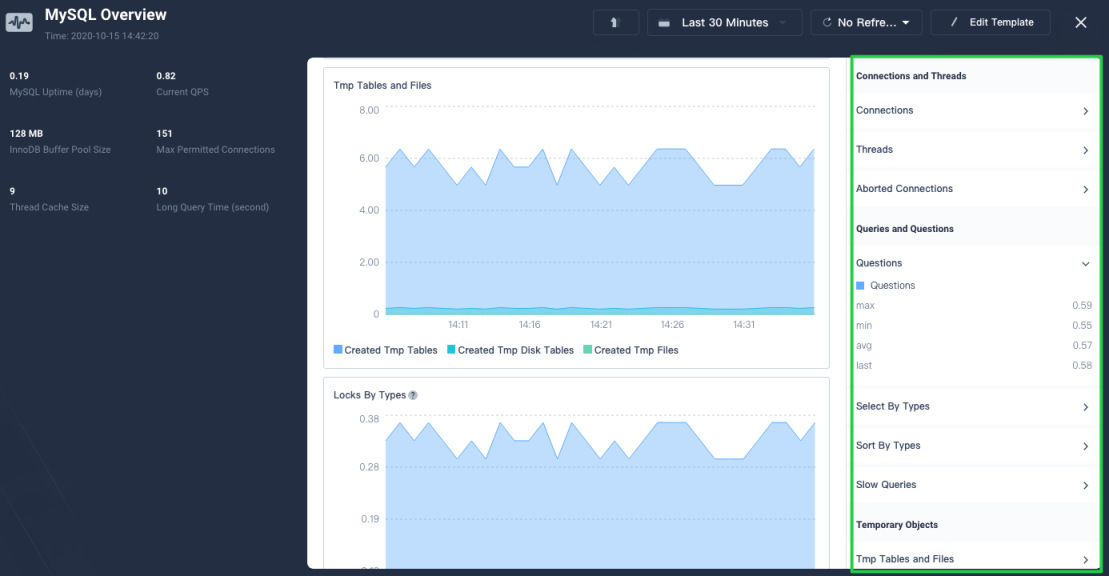
Detail column
You can view chart details in the right-most column. It shows the max, min, avg and last value of metrics within the specific period.
Edit the monitoring dashboard
You can modify an existing template by clicking Edit Template in the top right corner.
Add a chart
To add text charts, click the add icon in the left column. To add charts in the middle column, click Add Monitoring Item in the bottom right corner.
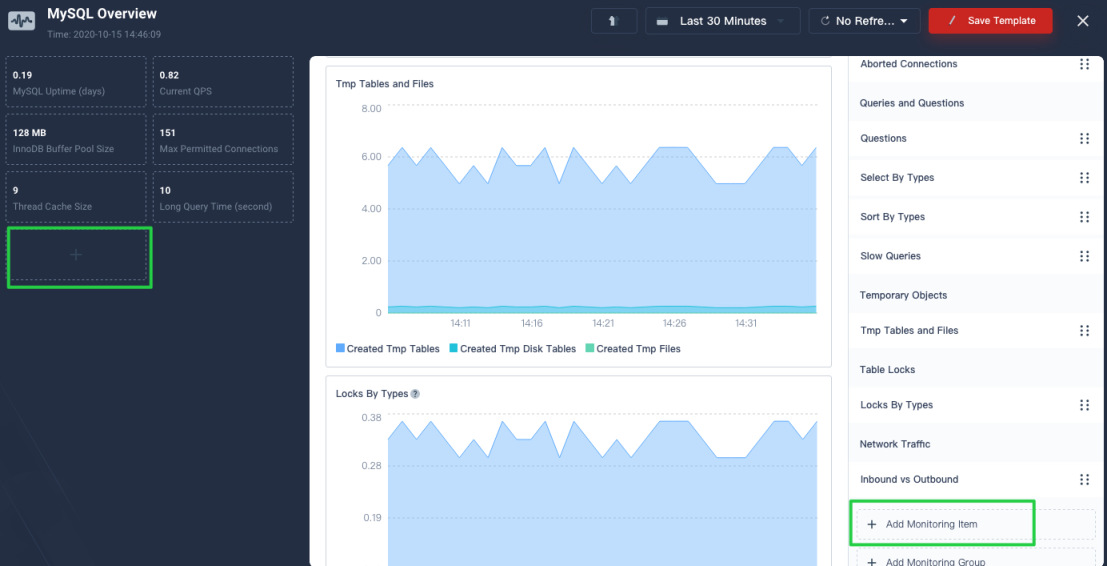
Add a monitoring group
To group monitoring items, you can drag and drop an item (the six dots on the right) into the target group. To add a new group, click Add Monitoring Group. If you want to change the place of a group, click the Up or Down arrow on the right.
Note
The place of group on the right is consistent with the place of charts in the middle. In other words, if you change the order of groups, the place of their respective charts will also change accordingly.
Dashboard Templates
Find and share dashboard templates in Monitoring Dashboards Gallery. It is a place for KubeSphere community users to contribute their masterpieces.
 Previous

What’s on this Page